5-54 Starling Monitor - User Guide
Performing a Dynamic Assessment Test
Explanation of Dynamic Assessment Test Results
Test Results in Dynamic Assessment Window
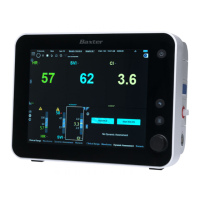
Whenever the Dynamic Assessment tab is currently selected (Figure 5-50), information
displayed in this window provides a quick indication of the results of the last Dynamic
Assessment Test performed.
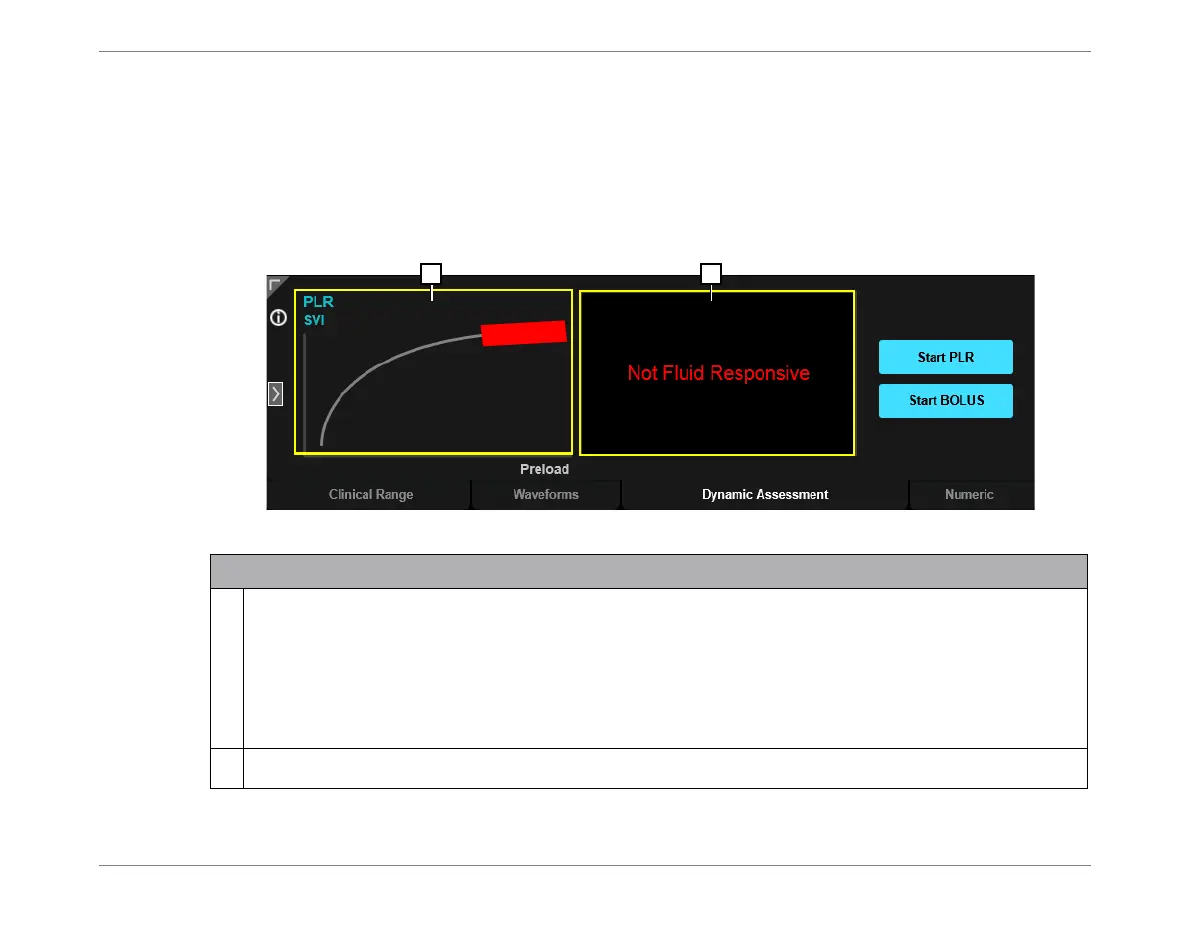
Figure 5-50 Dynamic Assessment Tab - Latest Test Results
Legend,Figure 5-50
1
The Starling Curve - provides a more physiological representation of the fluid responsiveness of
the patient, giving the clinician a deeper appreciation of the physiologic context of the PLR/Bolus
result.
The Starling Curve graphic comprises the Curve itself, and a "Fluid Bar" indicator.
The color (red or green) and the location at which the indicator is displayed on the curve provides
a graphic representation of the patient’s fluid status.
a
See examples in Figure 5-51.
a. If the SVI is >10%, the indicator is located on the ascending part of the Starling Curve.
If the SVI is <10%, the indicator is located on the static part of the Starling Curve.
2
Message indicating patient’s fluid responsiveness as determined by the Starling system.