©2020 Baxter International Inc. 3- 9
Home Screen
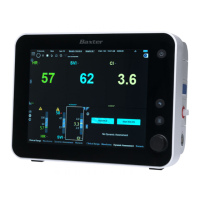
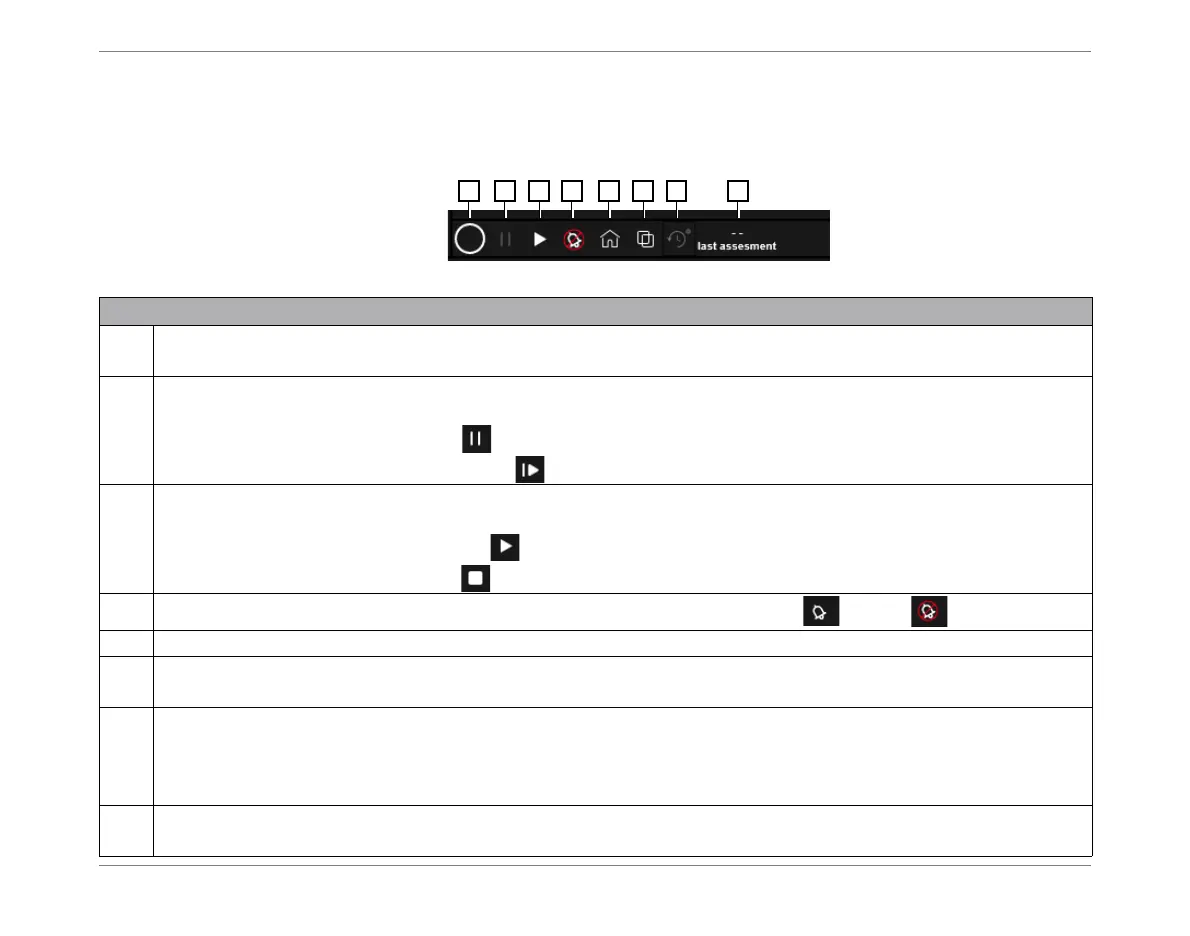
Controls Toolbar
The Controls toolbar is constantly displayed at the top of the screen so the controls are always
readily available.
Figure 3-4 Controls Toolbar
Legend, Figure 3-4
1
Refresh rate button. Opens drop-down menu enabling user to select the required sampling rate at which
displayed results are refreshed. Options are: every 4, 8, 16, 24, or 48 secs.
2
Button toggles between two functions, depending on current monitoring status; button appearance
changes accordingly:
Monitoring Session in progress used to Pause the current Session
Monitoring Session currently
paused
used to Resume monitoring; the
same
Session continues.
3
Button toggles between two functions, depending on current monitoring status; button appearance
changes accordingly, as follows:
No Monitoring Session in progress opens the Patient Management Window
Monitoring Session in progress used to Stop the current Session
4
Alert icon - indicates whether Audible Alert function is currently set to ON or OFF
5
Home button - returns to the default Home Screen (i.e. the view currently-set as the default template).
6
View options - opens predefined templates enabling user to choose (or modify) preferred view layout for the
Home Screen display. For examples, see Changing the Home Screen Display Layout.
7
Session History button - provides access to history of any former Sessions for the selected patient, over last
12 hours. For these, displays
Trends
,
Numeric
data and
Dynamic
Assessments
.
For more details, see Using History Mode on page 3-34.
Note: if no Session History, button is disabled.
8
Displays time (hrs and mins) since last Dynamic Assessment performed.
If a Dynamic Assessment test is currently being performed, will show "In Progress".