©2020 Baxter International Inc. 3- 23
Home Screen
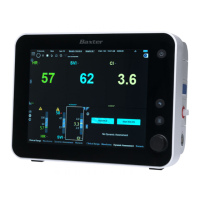
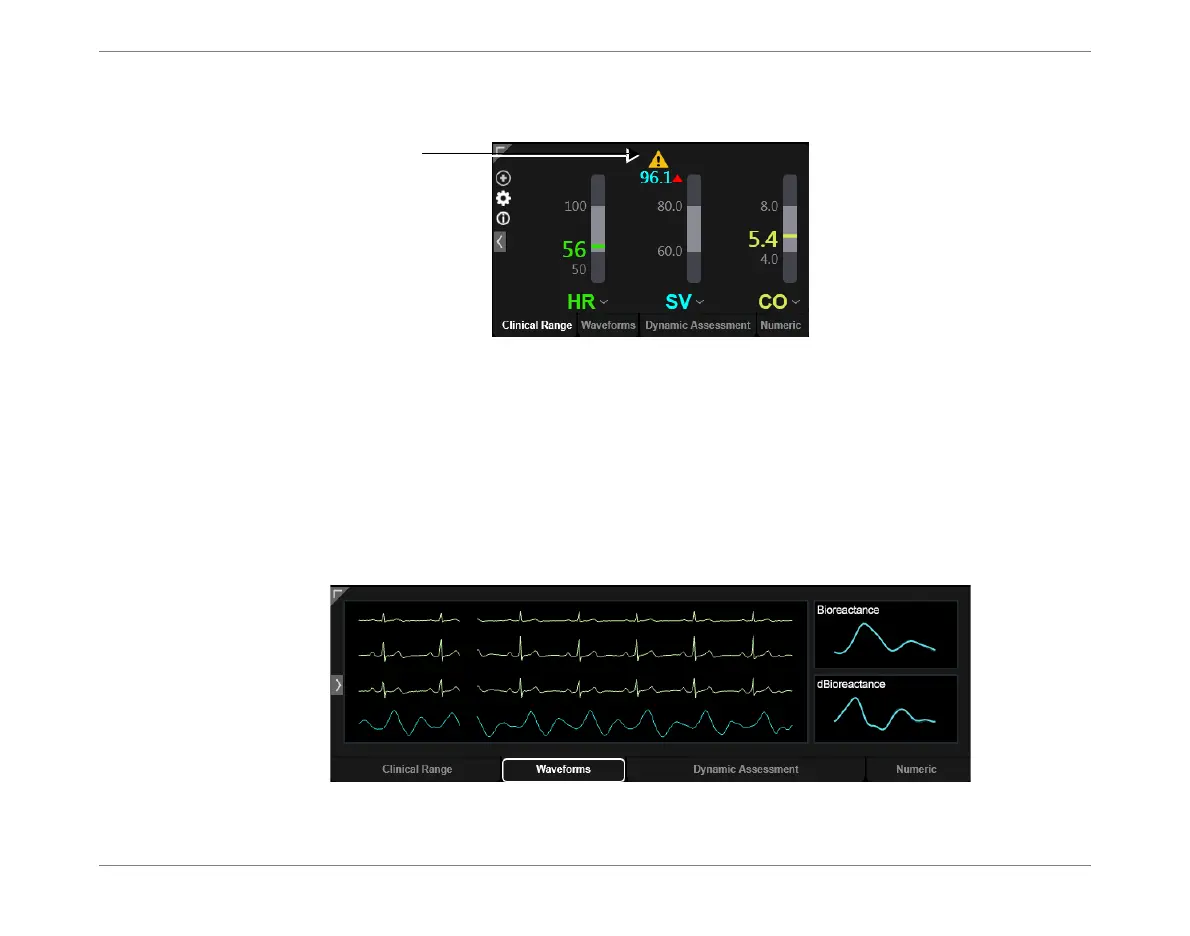
Any parameter value falling outside the defined Clinical Range prompts the display of a warning
(yellow triangle), as shown in the Stroke Volume example in Figure 3-16.
Waveforms
The Waveforms display presents four hemodynamic waveform graphs (three ECG traces, one
Bioreactance). On the right, two graphs indicate the following:
Bioreactance - Average morphology of the Bioreactance signal
dBioreactance - Average morphology derivative of the Bioreactance signal
Note Use the full-width or full-screen viewing options (
previously described
), as required.
Figure 3-16 Parameter Value Warning - Exceeds Maximum Limit
Warning
Value Exceeds
Defined Limit
Figure 3-17 Display Window - Waveforms Tab