©2020 Baxter International Inc. 3- 13
Home Screen
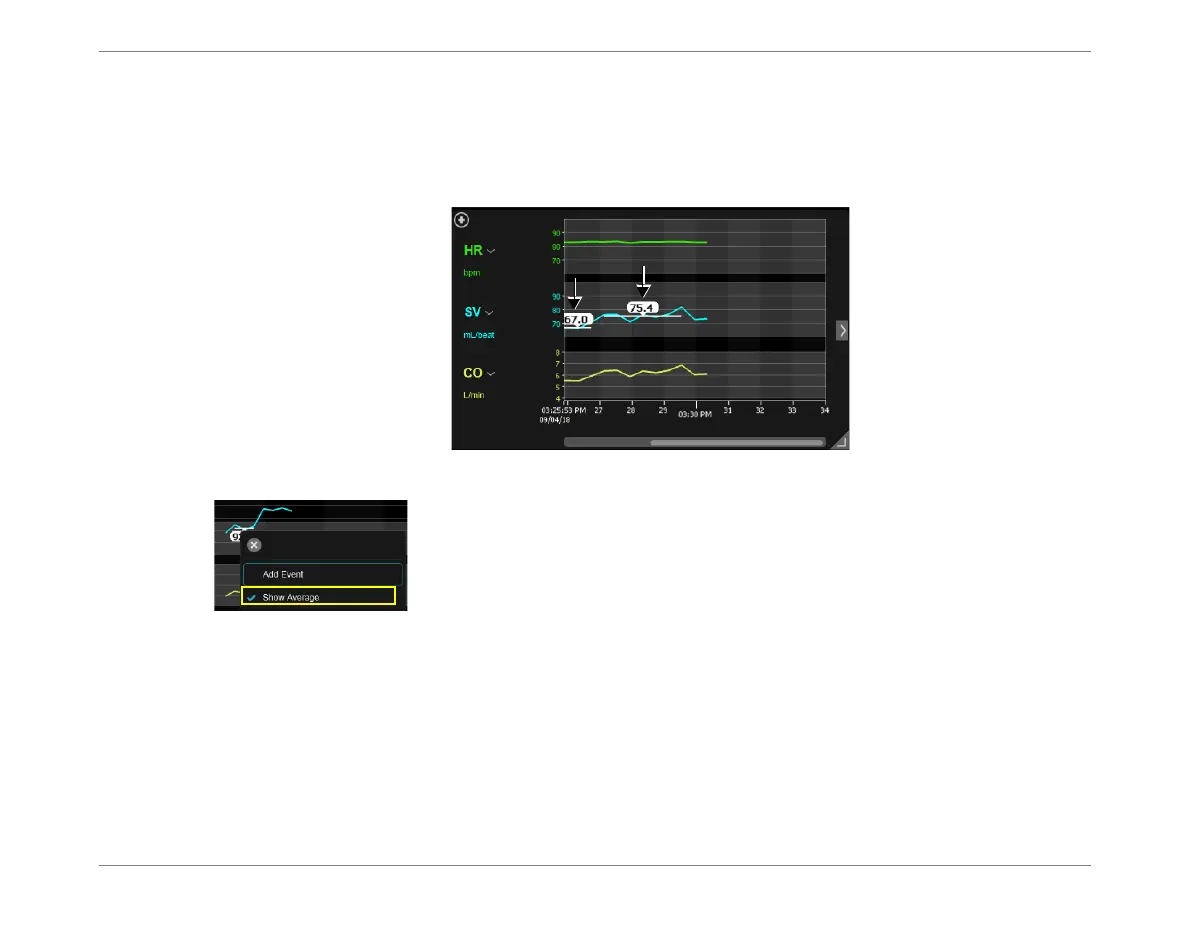
In the Trends display, when the SV (or SVI) parameter is currently selected for display, the user
has the option to
display
or
hide
SV (or SVI) Average Values.
Note
These values, which are averages calculated by the system over a 3-minute segment (or longer),
are displayed numerically on the graph, as shown in the example in Figure 3-7.
To hide the display of Average Values, tap on the graph, then deselect
the Show Average option from the menu.
Figure 3-7 SV Parameter showing SV Average Values