CAPINTEC, INC. CAPTUS
®
3000
CHAPTER 12
TIME ACTIVITY ANALYSIS
INTRODUCTION ............................................................................................ 12-1
SETTING UP PARAMETERS ........................................................................ 12-2
MAKING MEASUREMENTS .......................................................................... 12-5
Saving the Results .................................................................................... 12-7
VIEWING PREVIOUSLY SAVED RESULTS .................................................. 12-9
INTRODUCTION
Time Activity Analysis (TAA) permits the user to make repeated measurements at timed
intervals. It provides control over ROI, live time and real time for counting. The data can be
viewed as raw counts or decay corrected and displayed either in a graph or tabular form.
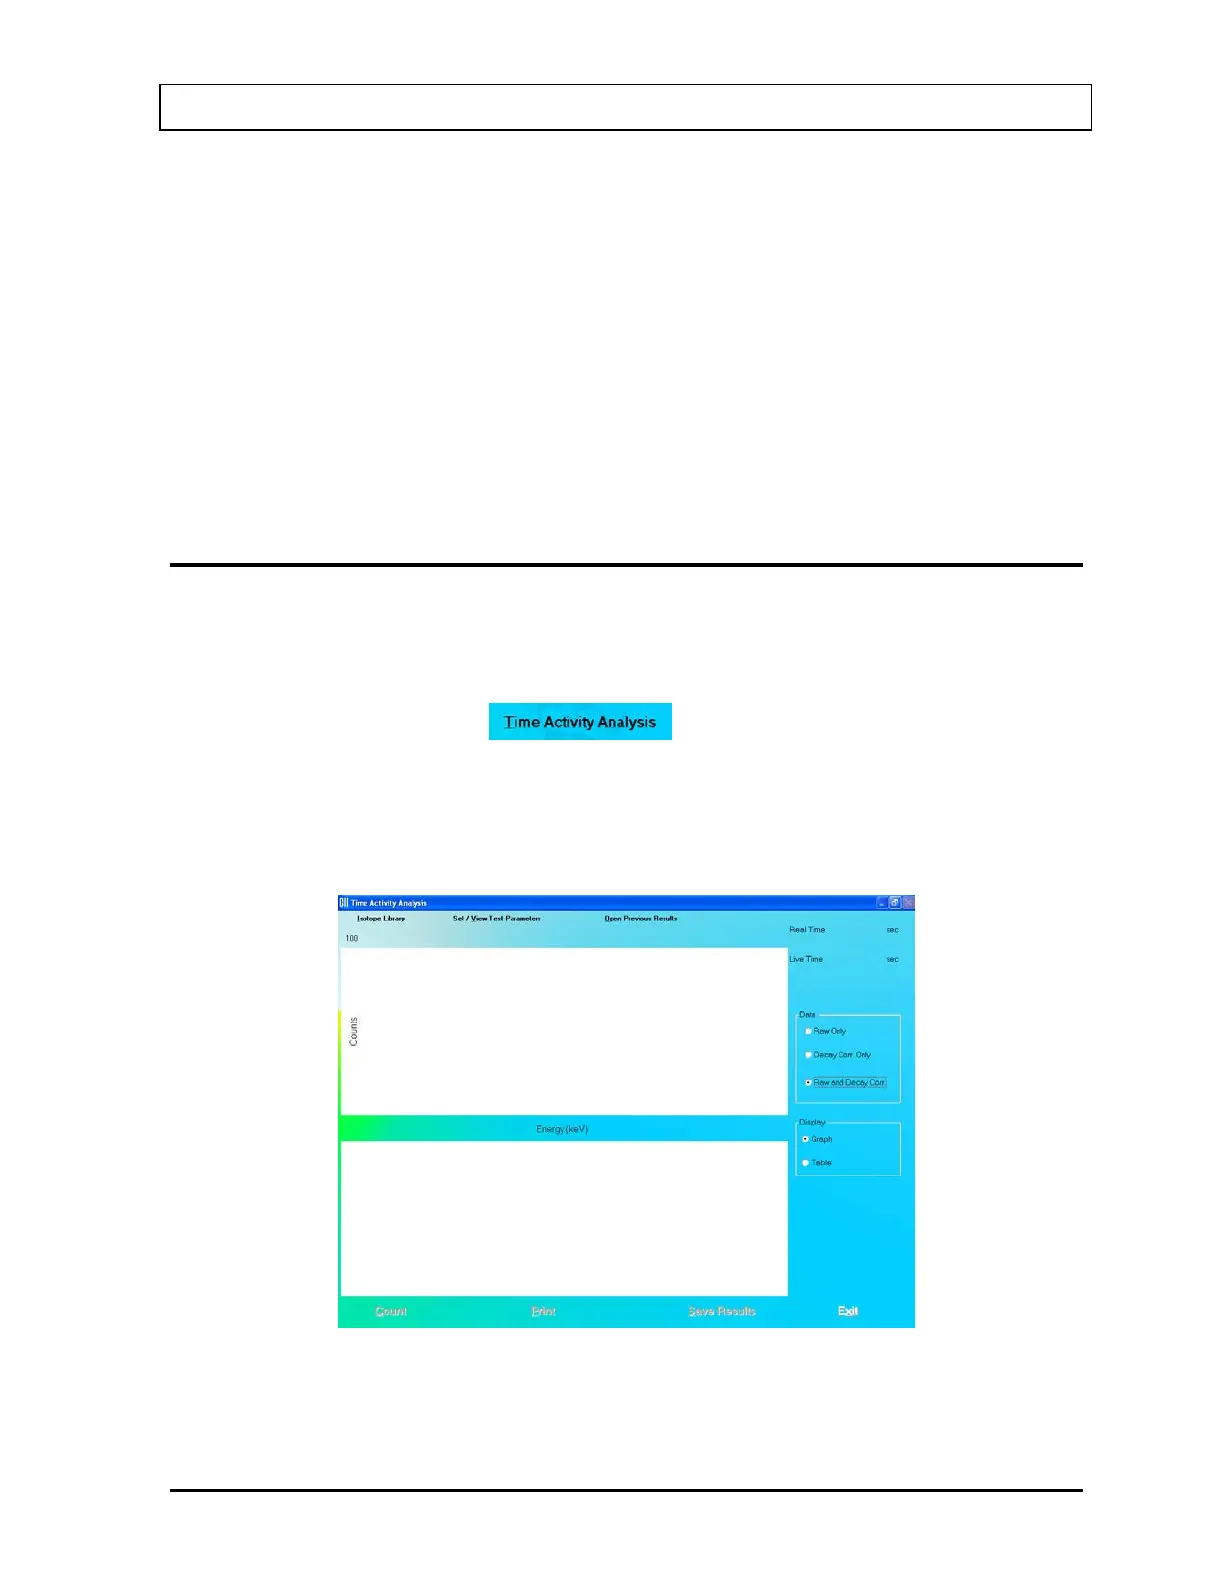
To access this module, click the
button or press Alt+T on the CAPTUS
®
3000 Main screen. Figure 12-1 Time Activity Analysis screen will appear. The functions at
the bottom of the screen are disabled until the required parameters have been entered.
When counting is started, a live spectrum is displayed in the upper half of the screen. The
elapsed real and live time is displayed at the upper right of the screen as the counting
progresses. Below the displayed time, there are options for viewing and displaying the data.
Figure 12-1 Time Activity Analysis screen
November 13 TIME ACTIVITY ANALYSIS 12-1