10 Monitor Spectrum Measurement
Meas Setup
Couplings This matters when testing a trace or limit line for failure, via :CALC:MON:LLIN3:FAIL? or
:CALC:MON:TRAC2:FAIL?
Preset 1|1|2|2|3|3
State Saved Saved in instrument state
Range 1|2|3
Initial S/W Revision A.13.00
Interpolation
Accesses a menu that lets you set the frequency and amplitude interpolation of the selected limit.
Key Path
Meas Setup, Limits, Properties
Readback In square brackets, the state of Frequency Interpolation then the state of Amplitude Interpolation,
separated by commas, as [Lin Frequency, Log Amplitude]
Initial S/W Revision A.13.00
Frequency Interpolation
Sets the interpolation between frequency points, allowing you to determine how limit trace values are
computed between points in a limit table. The available interpolation modes are linear and logarithmic. If
frequency interpolation is logarithmic (Log), frequency values between limit points are computed by first
taking the logarithm of both the table values and the intermediate value. A linear interpolation is then
performed in this logarithmic frequency space. An exactly analogous manipulation is done for logarithmic
amplitude interpolation.
Note that the native representation of amplitude is in dB.
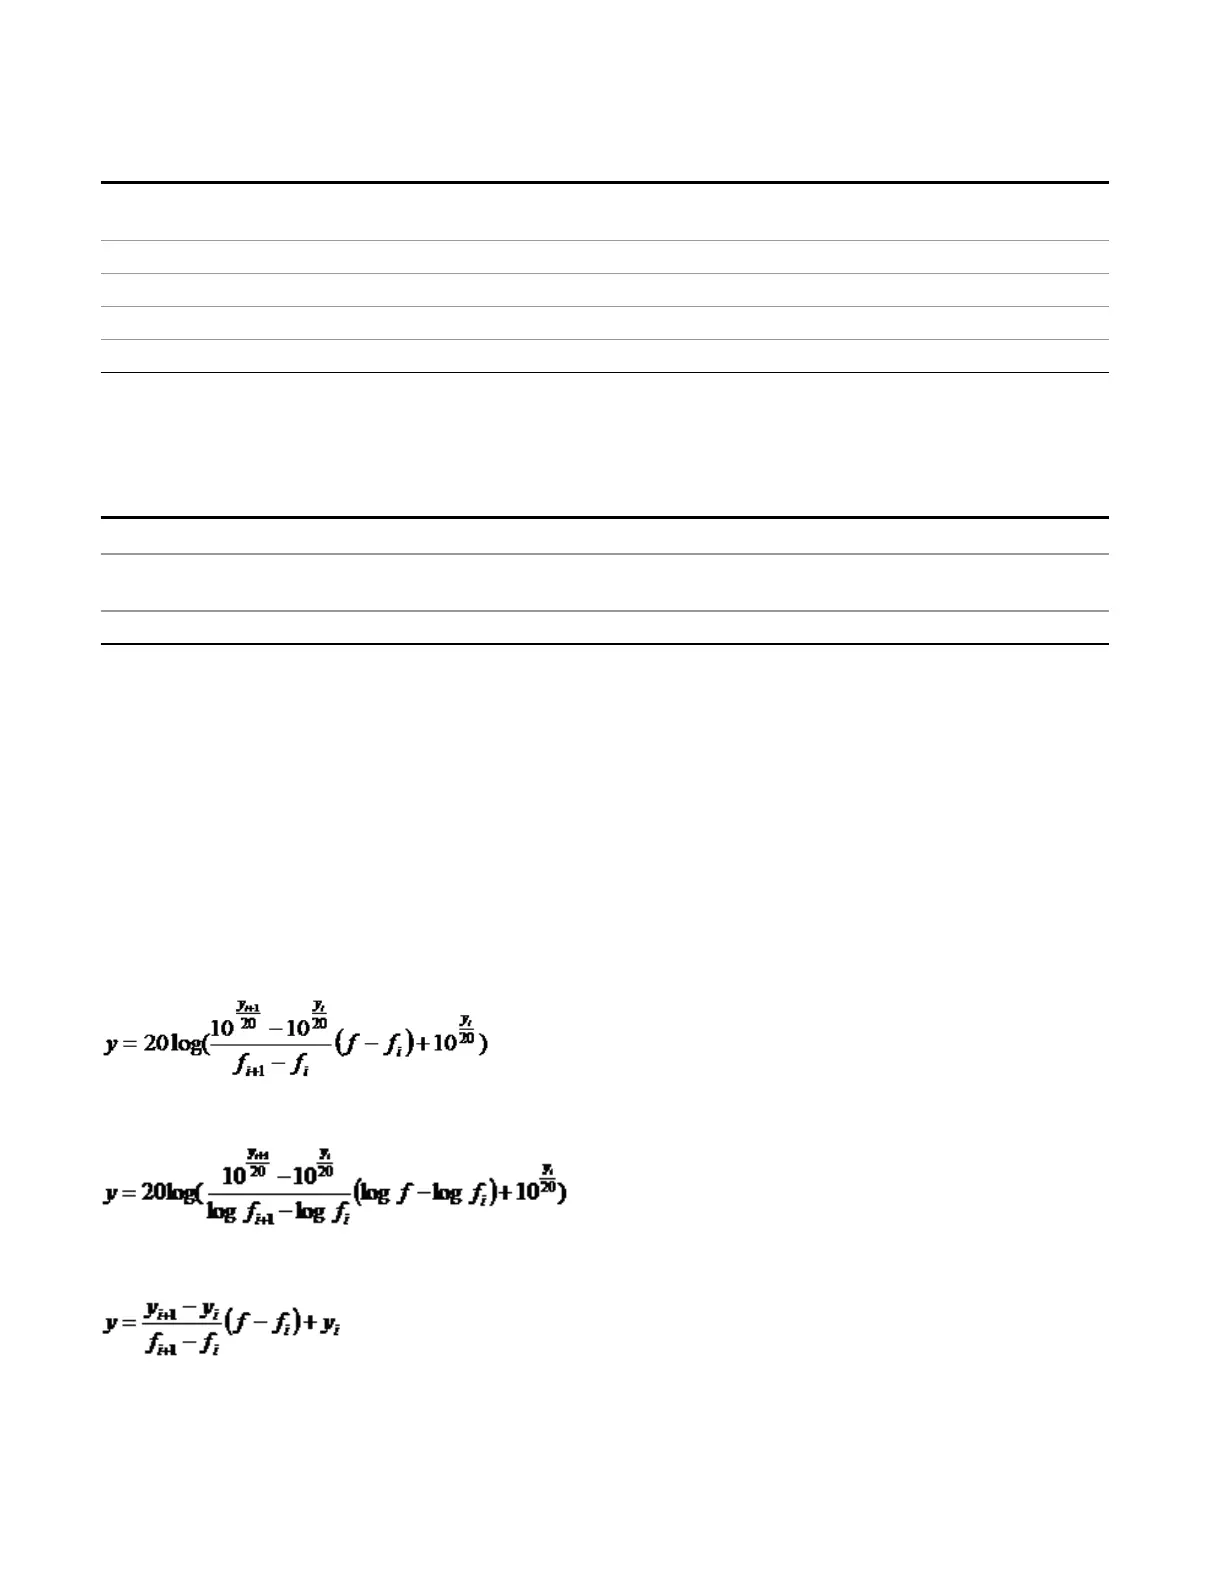
For linear amplitude interpolation and linear frequency interpolation, the interpolation is computed as:
For linear amplitude interpolation and log frequency interpolation, the interpolation is computed as:
For log amplitude interpolation and linear frequency interpolation, the interpolation is computed as:
For log amplitude interpolation and log frequency interpolation, the interpolation is computed as:
792 EMI Receiver Mode Reference
 Loading...


