2.
(Optional) Specify the aributes and/or display sample details:
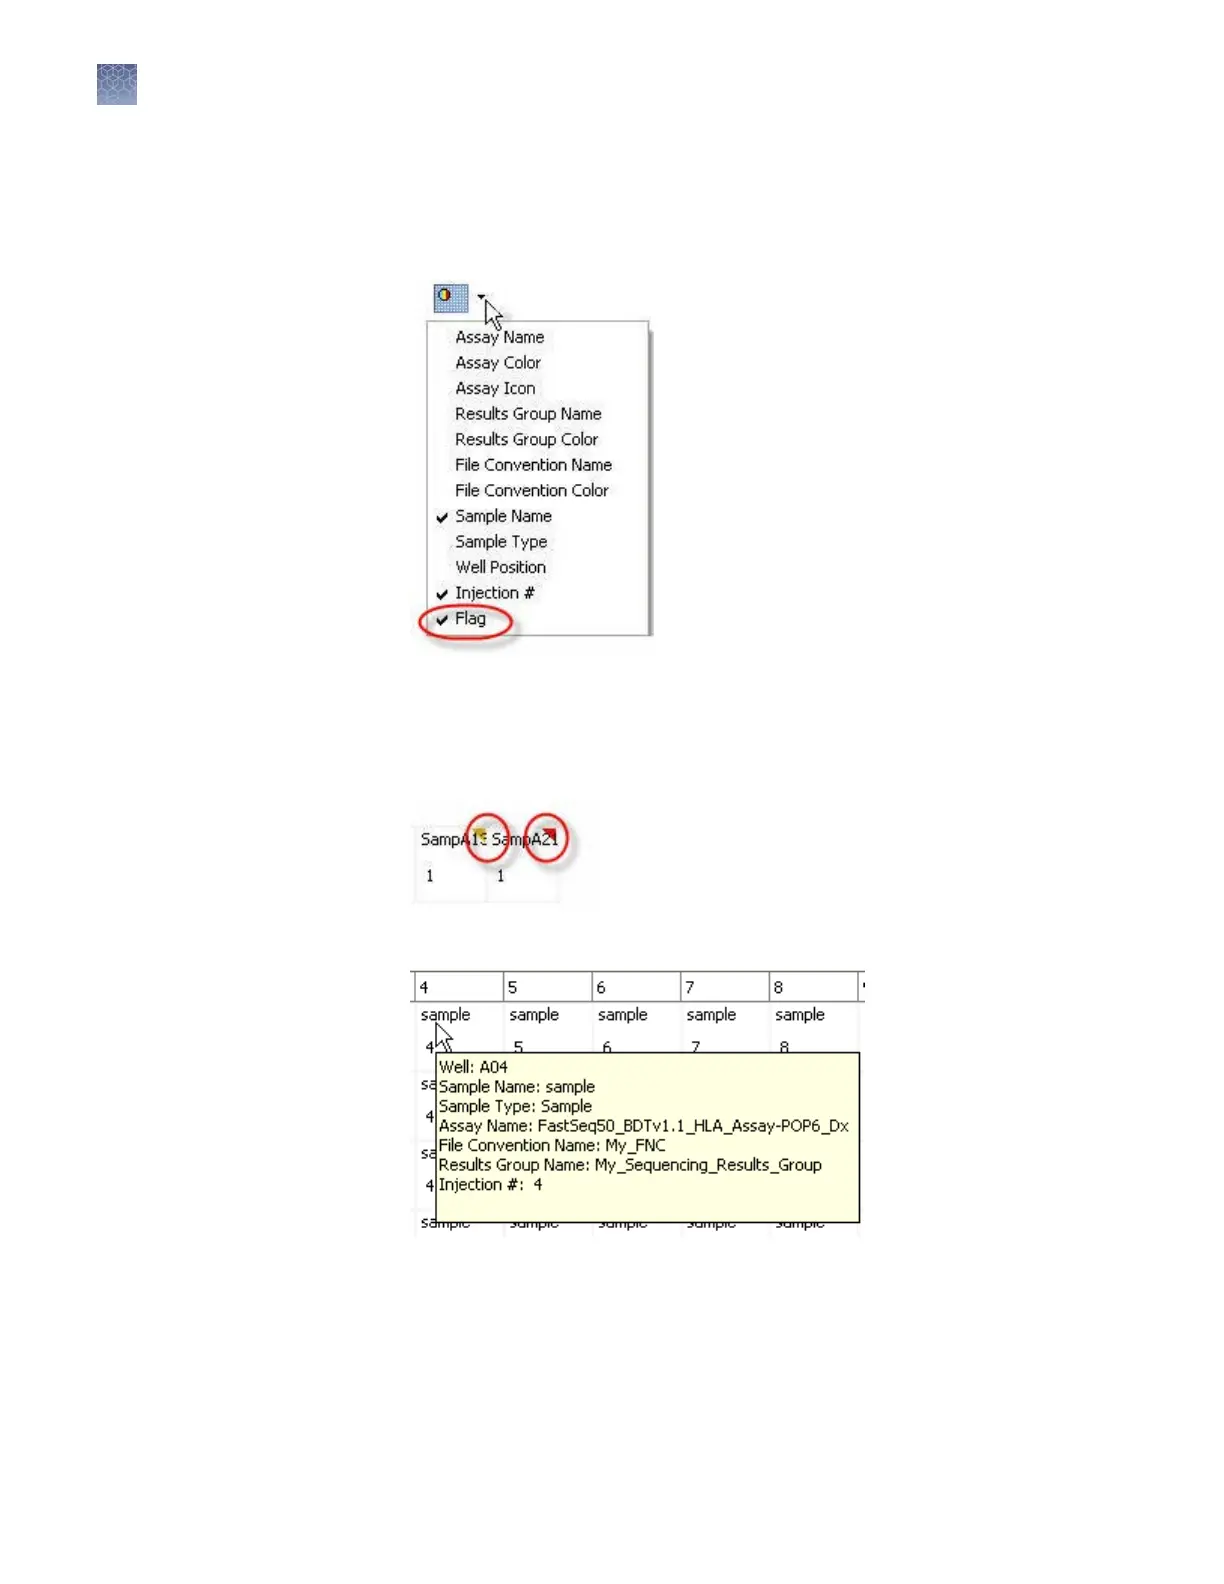
• Click the icon above the plate to specify the aributes to display in the plate
view. In addition to the aributes available in Preview Run, a Flag aribute
is available.
If you select the Flag aribute, green marks are display
ed for wells with
Average QV values that are within range, yellow marks are displayed for
wells with Average QV values that are in the suspect range, and red marks
are displayed for wells with Average QV values that are out of range.
• Place the mouse pointer over a well to display sample details.
Chapter 3 Set up and run
Monitor the run
3
66
3500/3500xL Genetic Analyzer User Guide—Data Collection Software v3.1