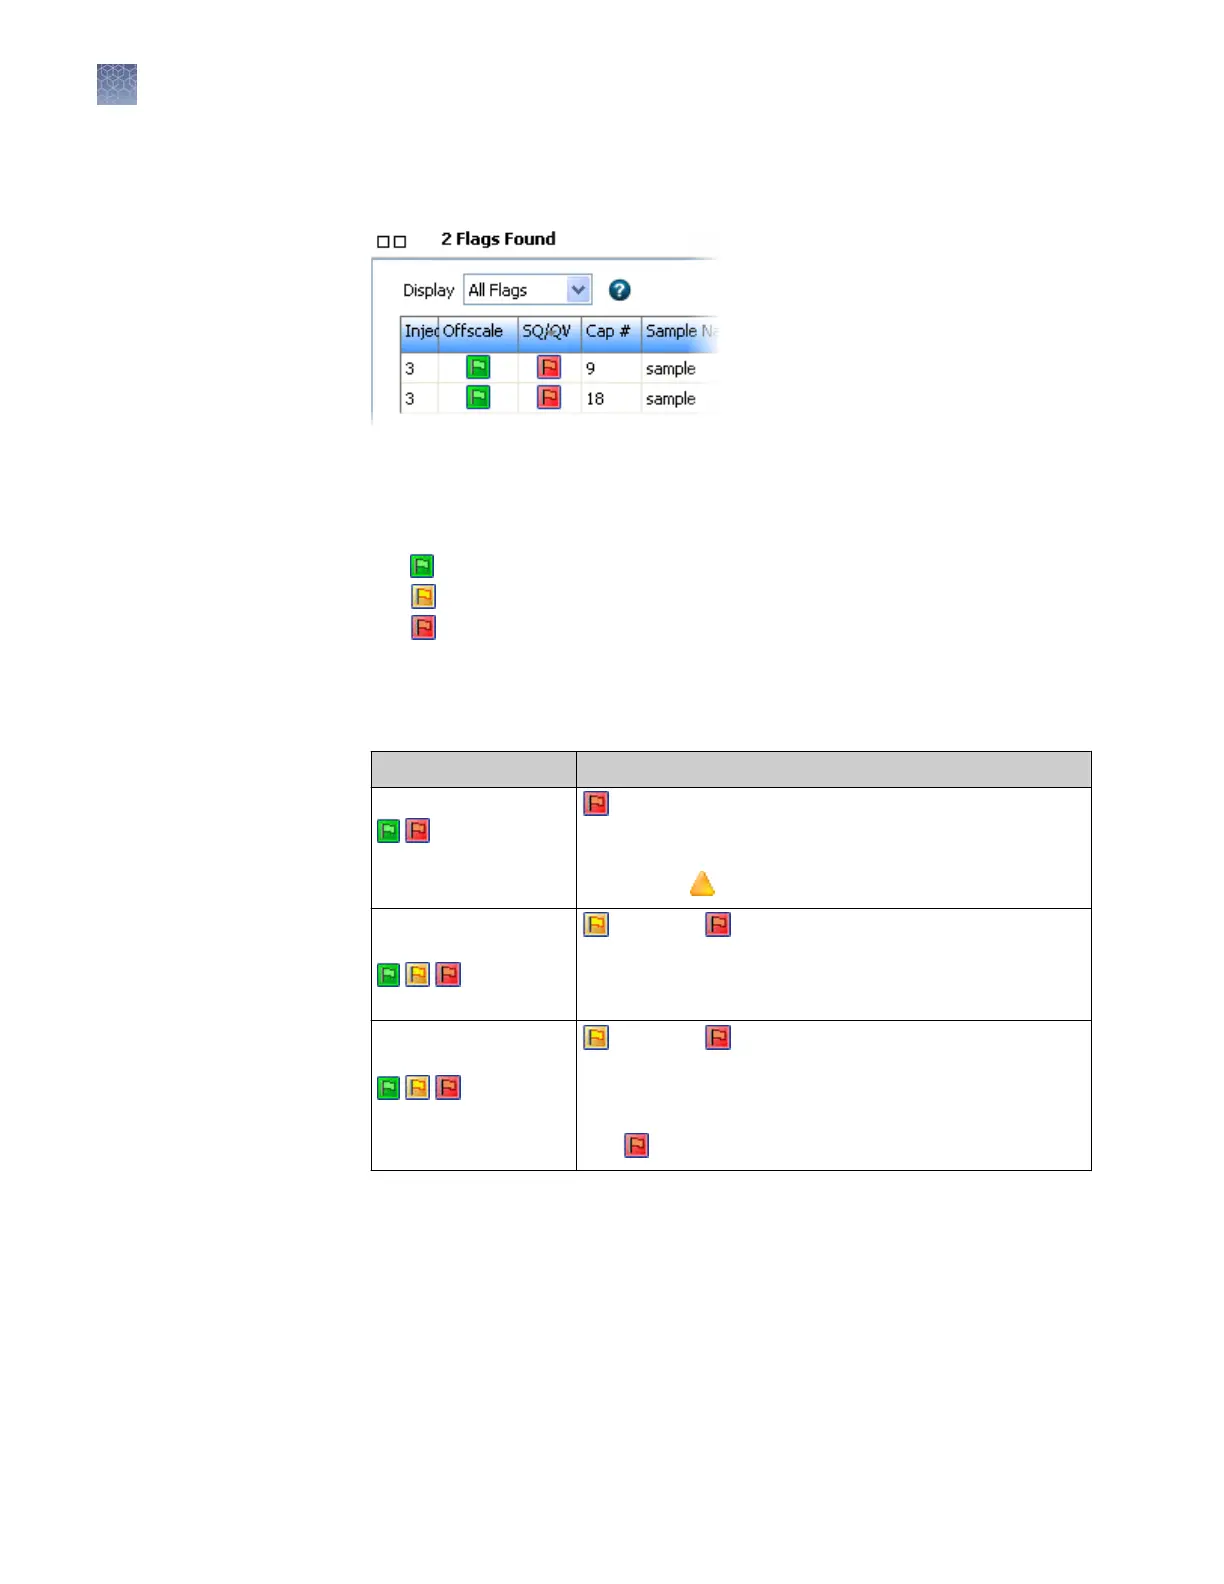
The ag table displays a quick preview of sample quality and identies samples
that may need inv
estigation. The ag table is linked to the plate view.
2.
Click a ag to select the associated w
ell in the plate view:
Note: If no samples are listed in this pane, no ags were found and the samples
have passed quality checks.
•
All samples passed
• At least one sample is in the suspect range and requires review
• At least one sample is oscale or is in the fail range
3.
T
o lter the ag table, select a ag type. To sort the table, double-click column
headers.
The ags you may see in the ag table are:
Flag/Symbols Description
Offscale
(green or red)
(red) At least one data point in the analysis range has
satur
ated the CCD camera.
Note: In the View Results screen, an offscale sample is
flagged with
.
QV: Average Quality
V
alue (sequencing)
(green, yellow, red)
(yellow) or (red) The Average Quality Value (based on
CRL, T
race Score, and QV20+ results) is in the Suspect or
Fail range. For information, see “Basecalling protocol—QV
settings“ on page 178.
SQ: Sizing Quality
(fragment)
(green, yellow, red)
(yellow) or (red) The Sizing Quality is in the Suspect
or F
ail range. For information, see “Sizecalling protocol—
QC settings“ on page 184.
IMPORTANT! Normalization is not applied to samples
with
(red) Sizing Quality.
Chapter 3 Set up and run
Check sequence or sample quality and re-inject samples
3
68
3500/3500xL Genetic Analyzer User Guide—Data Collection Software v3.1