CAPINTEC, INC. CAPTUS
®
3000
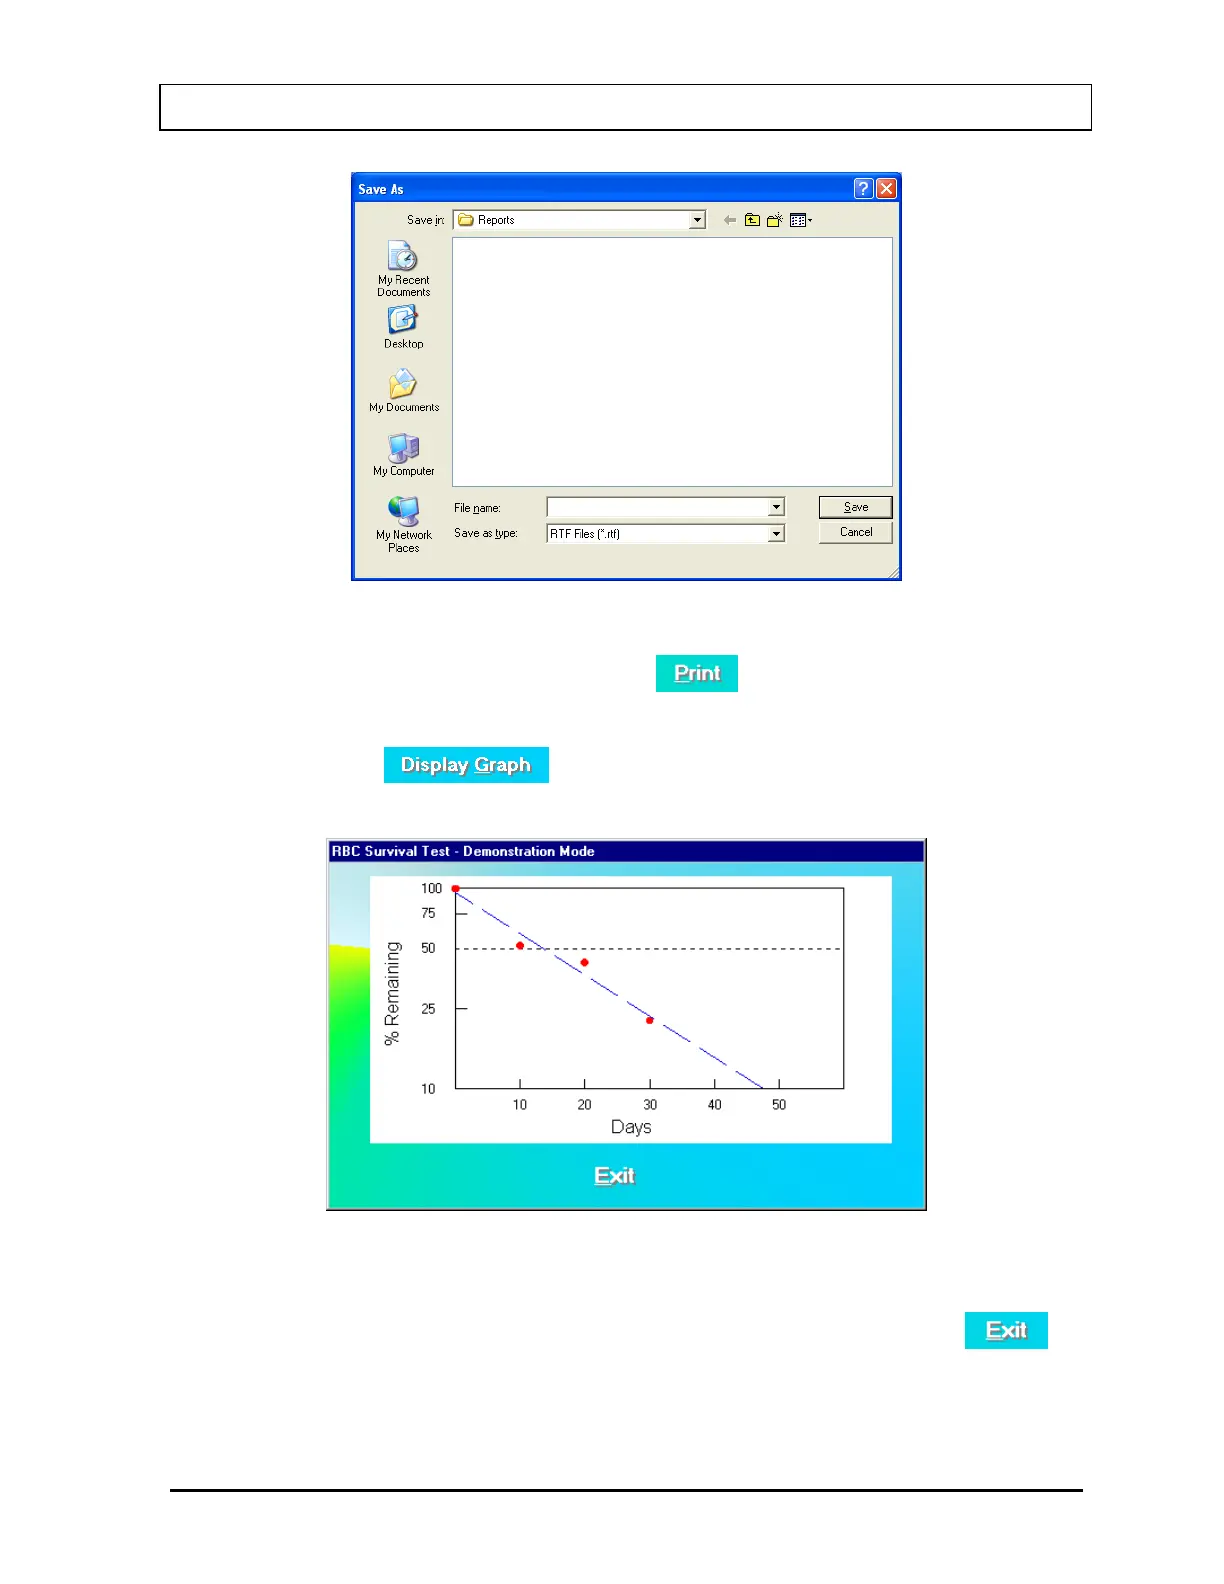
Figure 10-80
4. To print the report on the screen, click the
button or press ALT+P.
5. To view a graph of percentage RBC Remaining vs. Days passed after the injection
time, click the
button or press ALT+G. The screen appears as in
Figure 10-81.
Figure 10-81
The results are plotted on a semi-logarithmic scale. A best-fit straight line through the
data points is calculated using a least squares linear regression. Click the
button or press ALT+E to exit to the report screen.
November 13 LAB TESTS 10-53