1. SYSTEM INTRODUCTION
1-25
1.9.5 How to change the display method for the data in a data box
The data in the data boxes can be shown in graphic, numeric, or graph format.
1. Tap the data box to process.
2. At the top of the [Modify NavData] window, tap [Change Type]
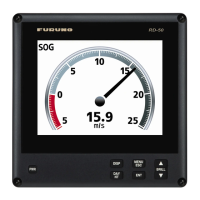
3. Tap [Graphic], [Numeric] or [Graph] as appropriate. The figure below shows the
appearance of SOG data in the available formats.
For Graph, the plotting period (horizontal axis) and plotting range (vertical axis)
can be changed.
1) Tap the data box to change.
2) Tap [Plot Period]*, then tap desired period, among 1'00s, 5'00s, 10'00s,
30'00s, 1h00, 3h00', 6h00', 12h00', 1d00h, and 2d00h.
* Depending on the display time, the number of data points displayed on the
graph may decrease, and the graph may become coarse.
3) Tap [Plot Range Value], and a software keyboard appears. Enter range value,
then tap [9].
4) Tap [×] to close the keyboard.
4. Tap [9] to close the [Modify NavData] window.
1.9.6 How to adjust the transparency of the data area
1. At the Home screen, tap [Settings]→[Chart Plotter].
2. Tap [NavData Transparency]. Select desired transparency, from 0-80(%).
3. Tap [×] to close the menu.
Note: Alpha blending technology is used for transparency effects.
[Graphic]
Analog format
[Numeric]
Digital format
[Graph]
Graph format
 Loading...