2. CHART PLOTTER
2-2
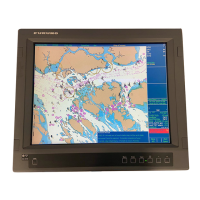
2.2 Display Range
You can change the display range to change the amount of information shown. The
selected range appears in the box at the bottom left-hand corner of the screen.
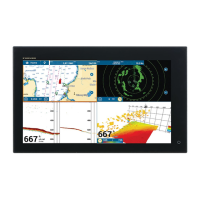
How to zoom in or out the display range
Method 1: Pinch the chart plotter display.
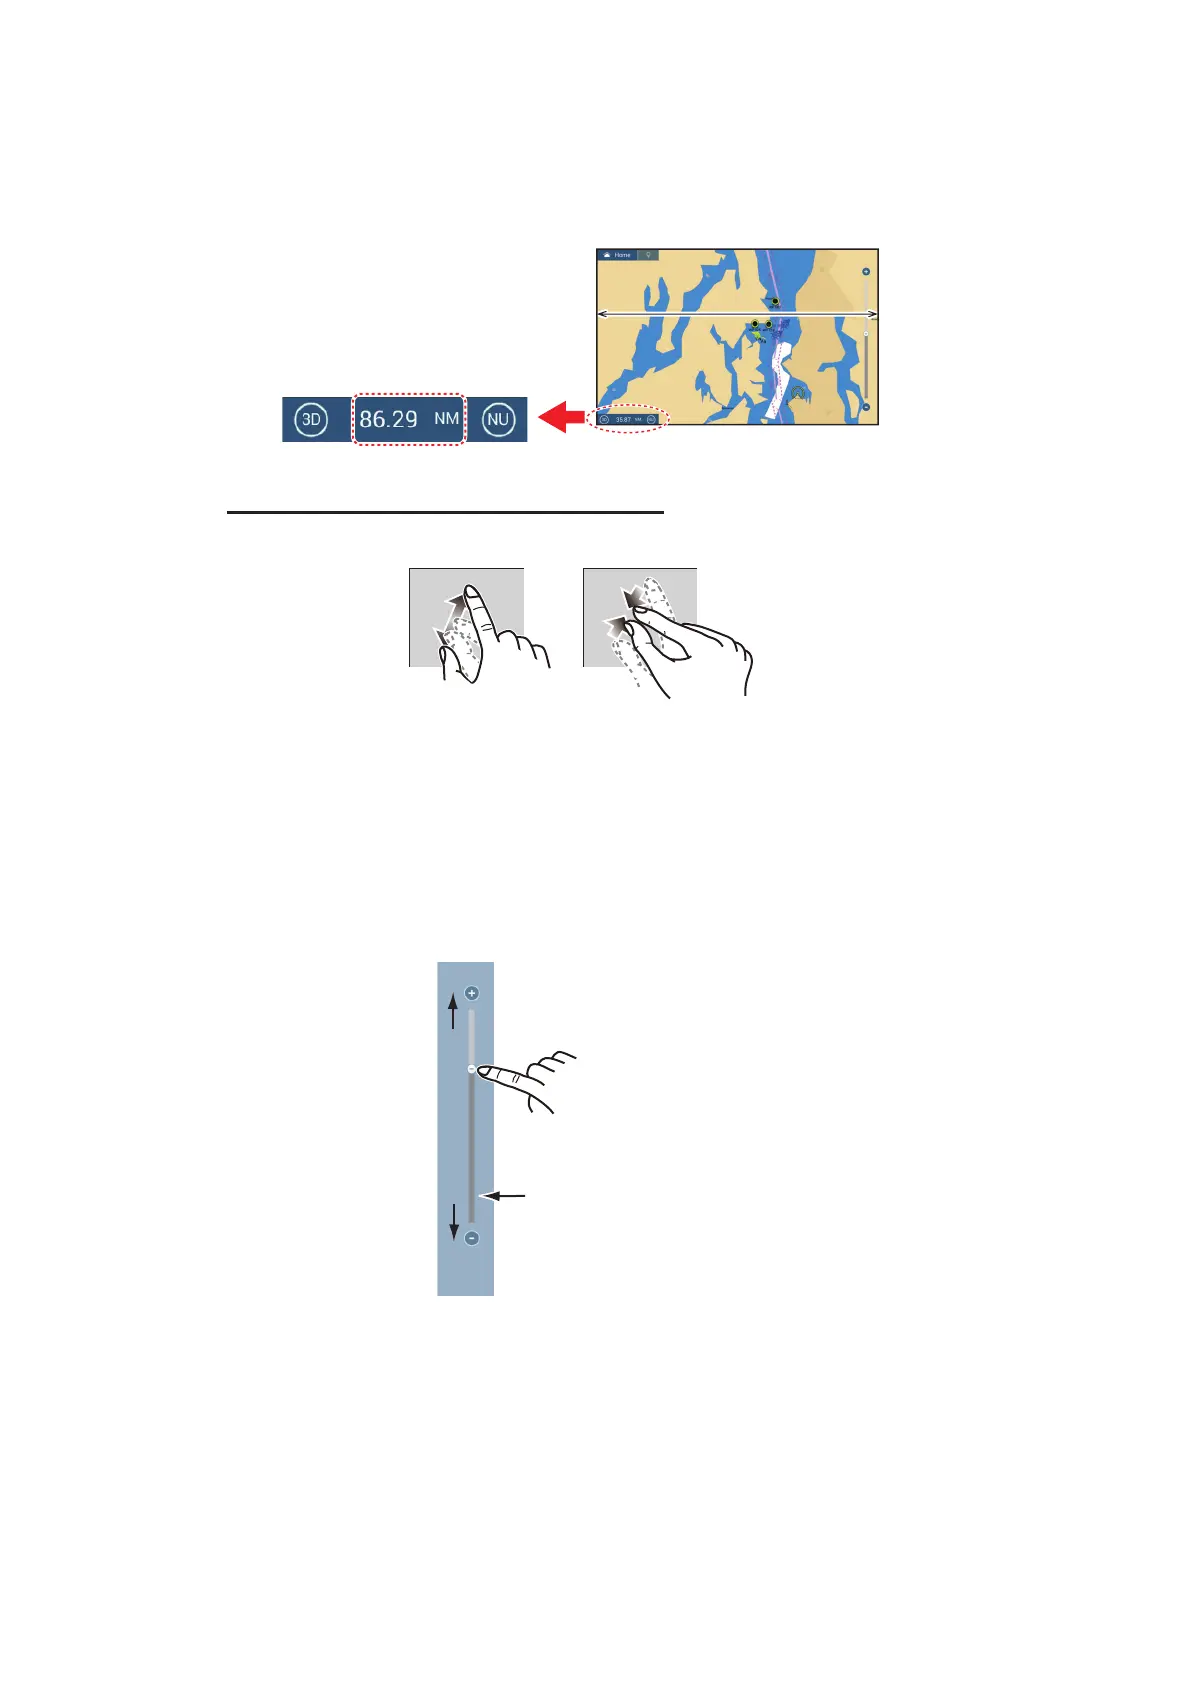
Method 2: Operate the slider to bar to adjust the display range, using one of the meth-
ods shown below.
1) Drag the slider.
2) Tap the bar.
3) Tap the "+" or "-" icon on the slider.
(The slider bar is shown in the default setting. The slider bar can be shown or hidden
with [Show Scale Slider] in the [Settings]→[Chart Plotter] menu.)
Note 1: You can judge the suitability of the range by the color of the chart scale indi-
cation.
• Black: Range is appropriate for chart accuracy.
• Red: Range is inappropriate for chart accuracy.
Note 2: You can zoom the display range in or out from the preview screen.
Method 3 (TZT12F only): Turn the RotoKey
™
clockwise to zoom in. Turn counter-
clockwise to zoom out.
Display range
Range area
Zoom in
Zoom out
Drag the slider
(or tap bar or +, - icons)
Zoom in
Zoom out
Slider bar
 Loading...