2. CHART PLOTTER
2-21
[SST Variation]: Change the color of the track according to variation in sea sur-
face temperature. The following is an example.
[Speed]: Change the color of the track with speed.
[Bottom Discrimination]: Change the color of the track with bottom sediment.
[Depth Variation]: Change the color of the track with depth variation. The depth
at the start of track recording becomes the reference depth.
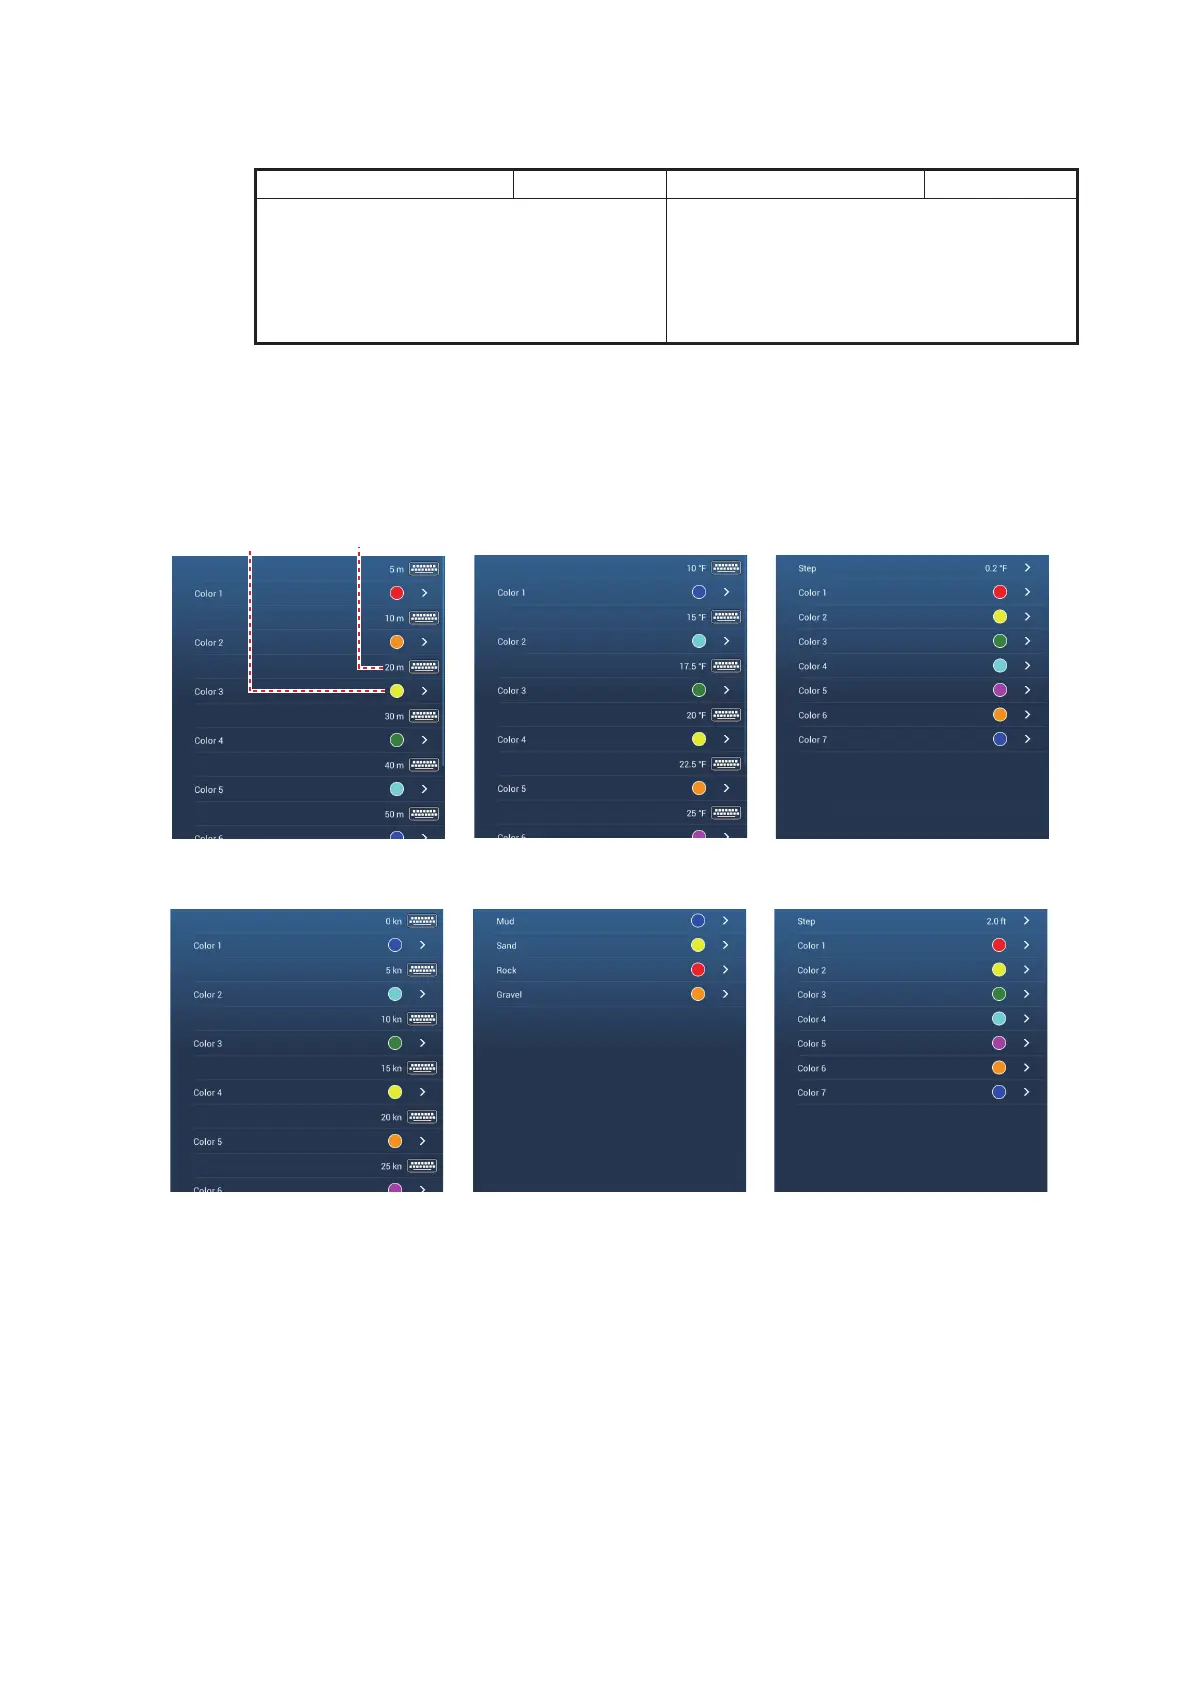
6. Tap [Variable Color Setup].
7. For [Bottom Discrimination], tap [Mud], [Sand], [Rock] or [Gravel]. For others, tap
a color (seven choices).
8. Tap a color for each menu item.
[Depth]: Set the color for each depth range. For example, when the red icon is se-
lected in [Color 1], the track is red for depths from 5 to 10 ft.
[SST Range]: Set the color for each range of sea surface temperature. For exam-
ple, when the blue icon is selected in [Color 1] (temperature range: 10 to 15°F),
the track is blue for temperatures from 10 to 15°F.
[SST Variation]: Set the color for each temperature variation. Tap [Step 0.2°F],
then set each color. Do the same for [Step 2.0°F].
[Speed]: Set the color for each speed range. For example, when the blue icon is
Temp. range (°F) Color Temp. range (°F) Color
16.60 to 16.80 Red 17.61 to 17.80 Orange
16.81 to 17.00 Yellow 17.81 to 18.00 Blue
17.01 to 17.20 Green 18.01 to 18.20 Red
17.21 to 17.40 Light-blue 18.21 to 18.40 Yellow
17.41 to 17.60 Purple 18.41 to 18.60 Green
For [Depth] For [SST Range]
For [Bottom Discrimination]
Threshold amount
Color icon
For [SST Variation]
For [Depth Variation]
For [Speed]
 Loading...