Gocator 2300 & 2880 Series
Gocator Web Interface • Scan Setup and Alignment • 113
combined view of sensors that have been aligned to use a common coordinate system.
Bottom: View from the bottom sensor in an opposite-layout dual-sensor system.
Left: View from the left sensor in a dual-sensor system.
Right: View from the right sensor in a dual-sensor system.
Left &Right: Views from both sensors, displayed at the same time in the data viewer, using the
coordinate systems of each sensor.
In the Measure page, the view of the display is set to the profile source of the selected measurement
tool.
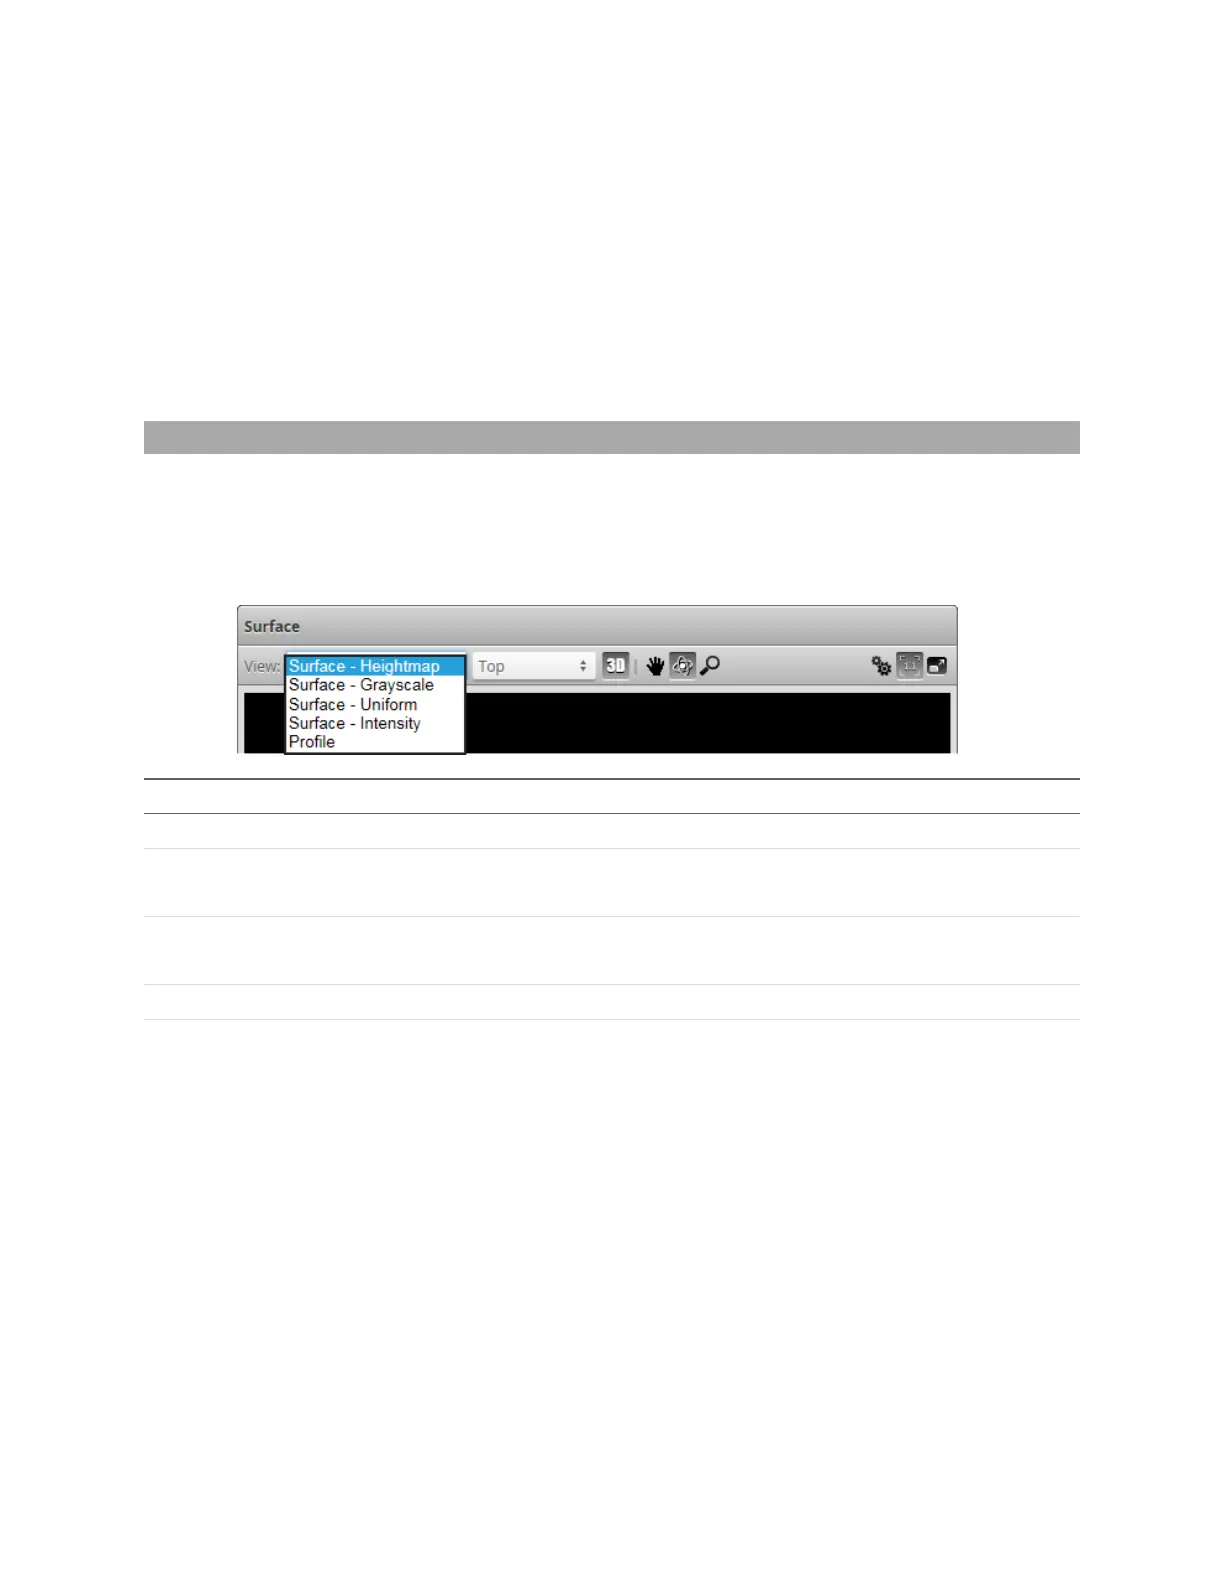
Surface Mode
When the Gocator is in Surface scan mode, the data viewer can display height maps and intensity
images. You can select the data to display from the View drop-down.
Clicking on the 3D button displays Surface data in the 3D viewer. The 3D model is overlaid with the
information that corresponds to the selected View option.
View Option Information
Profile Plots the last collected profile. (Only available in 2D view.)
Surface - Heightmap In 2D view, displays the pseudo color height map.
In 3D view, overlays the 2D pseudo color height map on the 3D model.
Surface - Grayscale
In 2D view, displays the grayscale height map.
In 3D view, overlays the grayscale height map on the 3D model.
Surface - Uniform Overlays a uniform shaded surface on the 3D model. (Only available in 3D view.)
Surface - Intensity In 2D view, displays the intensity.
In 3D view, overlays the intensity map on the 3D model.
(Acquire Intensity must be checked in the Scan Mode panel.)
Choosing the Profile view option will switch the data viewer out of the 3D viewer and display the profile
plot.
 Loading...