Gocator 2300 & 2880 Series
Gocator Web Interface • User Interface Overview • 54
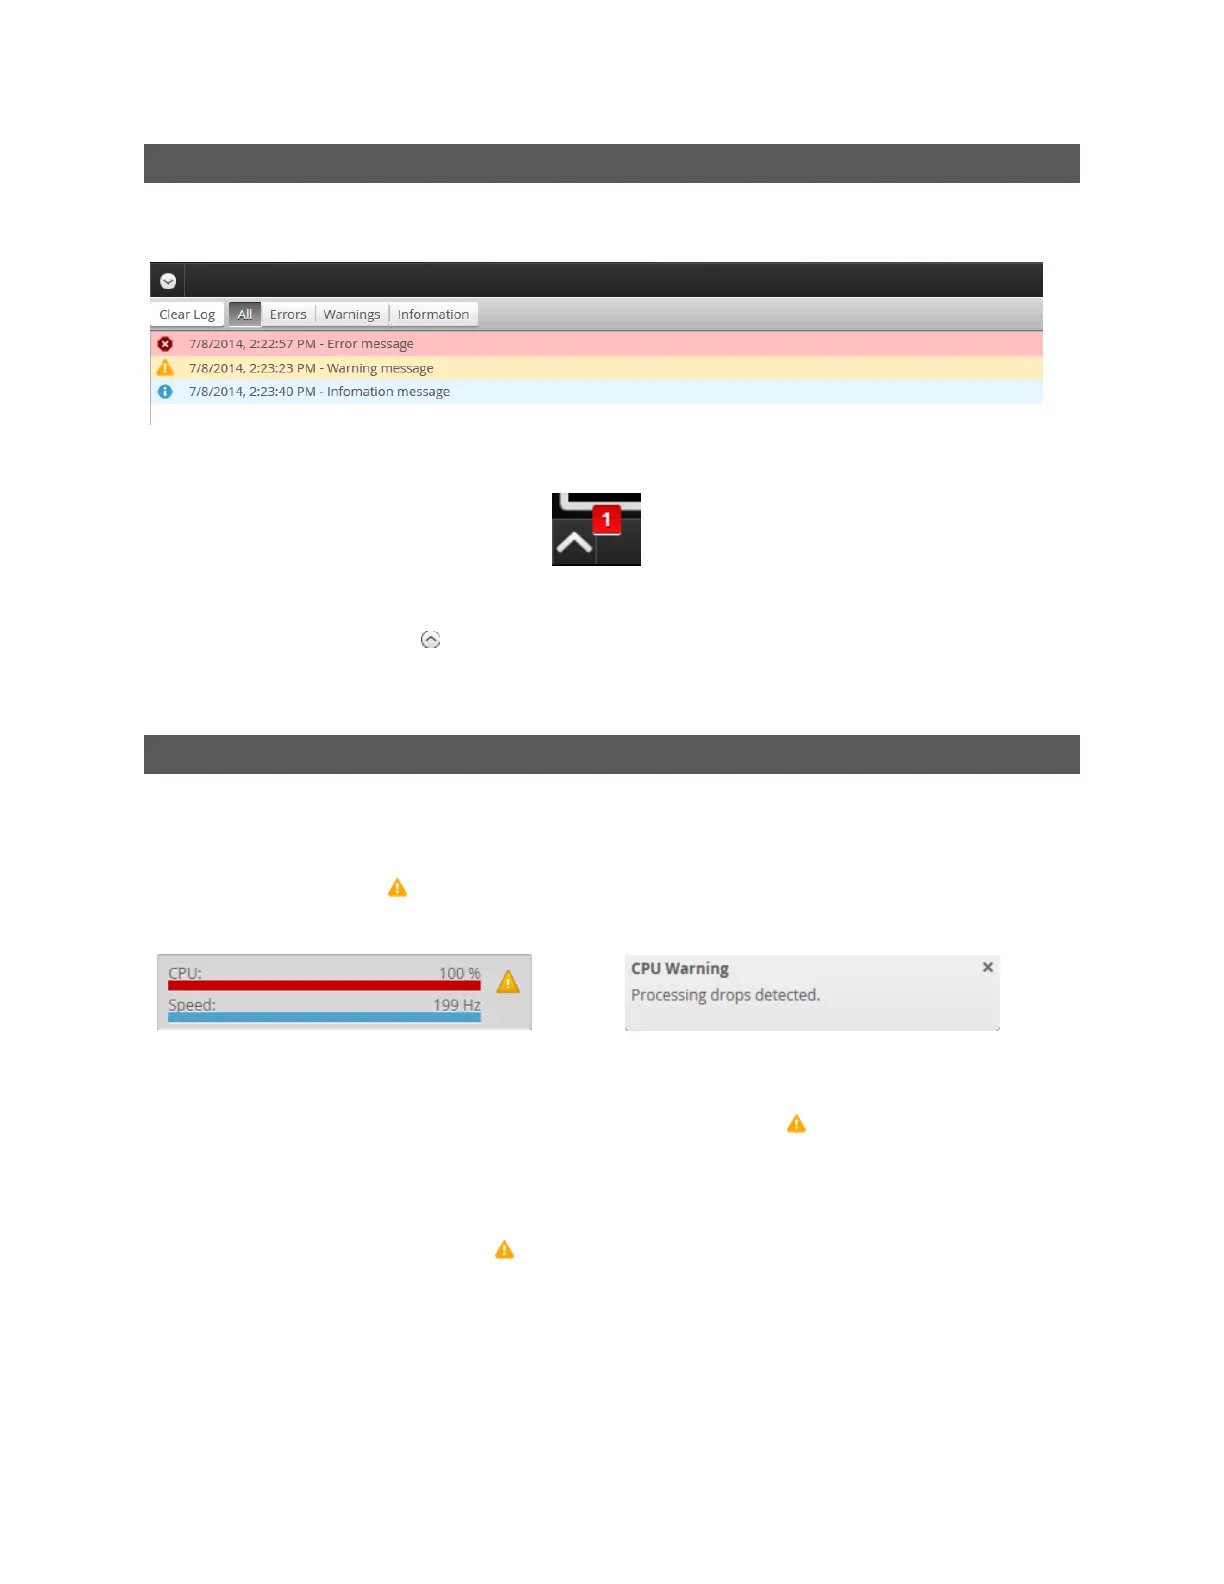
Log
The log, located at the bottom of the web interface, is a centralized location for all messages that the
Gocator displays, including warnings and errors.
A number indicates the number of unread messages:
To use the log:
1. Click on the Log open button at the bottom of the web interface.
2. Click on the appropriate tab for the information you need.
Metrics Area
The Metrics area displays two important sensor performance metrics: CPU load and speed (current
frame rate).
The CPU bar in the Metrics panel (at the top of the interface) displays how much of the CPU is being
utilized. A warning symbol ( ) will appear next to the CPUbar if the sensor drops profiles because the
CPU is over-loaded.
CPUat 100%
CPUwarning message
The Speed bar displays the frame rate of the sensor. A warning symbol ( ) will appear next to it if
triggers (external input or encoder) are dropped because the external rate exceeds the maximum frame
rate.
In both cases, a warning message will be temporarily displayed in the lower right corner of the web
interface. Click on the warning symbol ( ) to redisplay the warning message.
Open the log for details on the warning. See Log above for more information.
 Loading...