RADWIN2000UserManual Release2.8.30 10‐13
TheMonitorLog
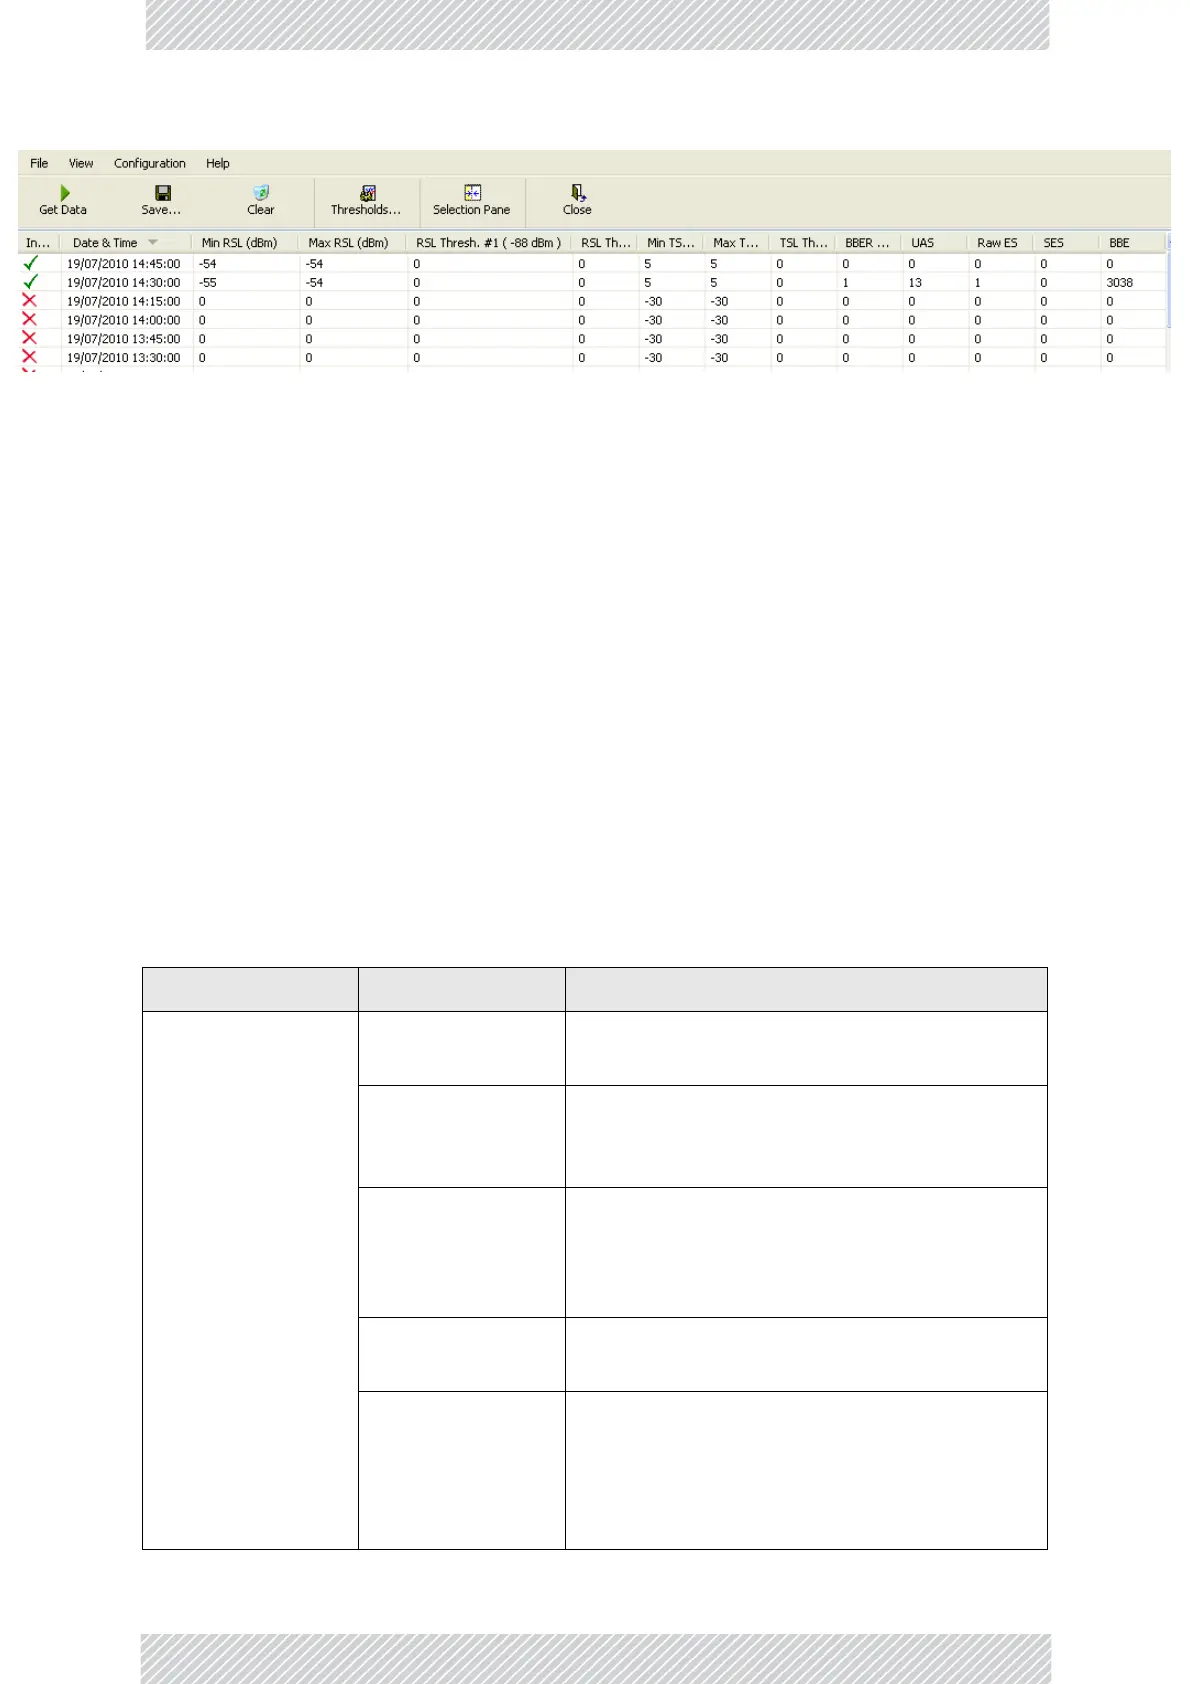
Figure10‐14:PerformanceMonitoringReportshowingtheeffectofaReset
Thepriordataisinvalidatedasshownbytheredcrossesinthelefthandcolumn.
Further,MinandMaxRSLfortheinvalidatedperiodissettozero.
3.ClicktheSelectionPaneicontotogglethesidepanelonoroff.
Theotherreportslooksimilar.Hereisadetaileddescriptionofthereportsandtheirfields:
Severalperformancedataoccurrencesarecollectedforeachoftheinterfaces(ES,SES,and
UAS),aswellasspecificdataperInterfacetype(e.g.,TxandRxbytesforEthernet).FortheAir
Interface,userdefinedthresholdsdataarecollected.RefertoTable10‐3andTable10‐4
below.
Dataiscollectedandselectivelydisplayedbasedonthreetimeintervalsasselectedbythe
Intervalradiobuttons:
• Current (t=0)
• 15minutesIntervals
• Daily
Table10‐3:Explanationofperformancedata
Datatype ReportedValue Explanation
GenericPMData
UAS–Unavailable
Seconds
Secondsinwhichtheinterfacewasoutof
service.
RawES–Raw
ErroredSeconds
Thenumberofsecondsinwhichtherewasat
leastoneerro rblock.Notethatthenotionofan
errorblockisdifferentperinte rface.
SES–Severe
ErroredSeconds
Thenumberofsecondsinwhichtheservice
qualitywaslow(thequalityisdifferentpertype
ofinterfaceanddeterminedbytheBBER
thresholdperinterface).
BBE–Background
BlockError
Thenumberoferroredblocksinaninterval.
Integrity
Aflagindicatingthatthedatawasvalid.Note
thatthePerformanceMonitoringdataisnot
validifnotallthevalueswerestored(e.g.,due
toclockchangeswithintheintervalorpower
upreset).