CAPINTEC, INC. CAPTUS
®
3000
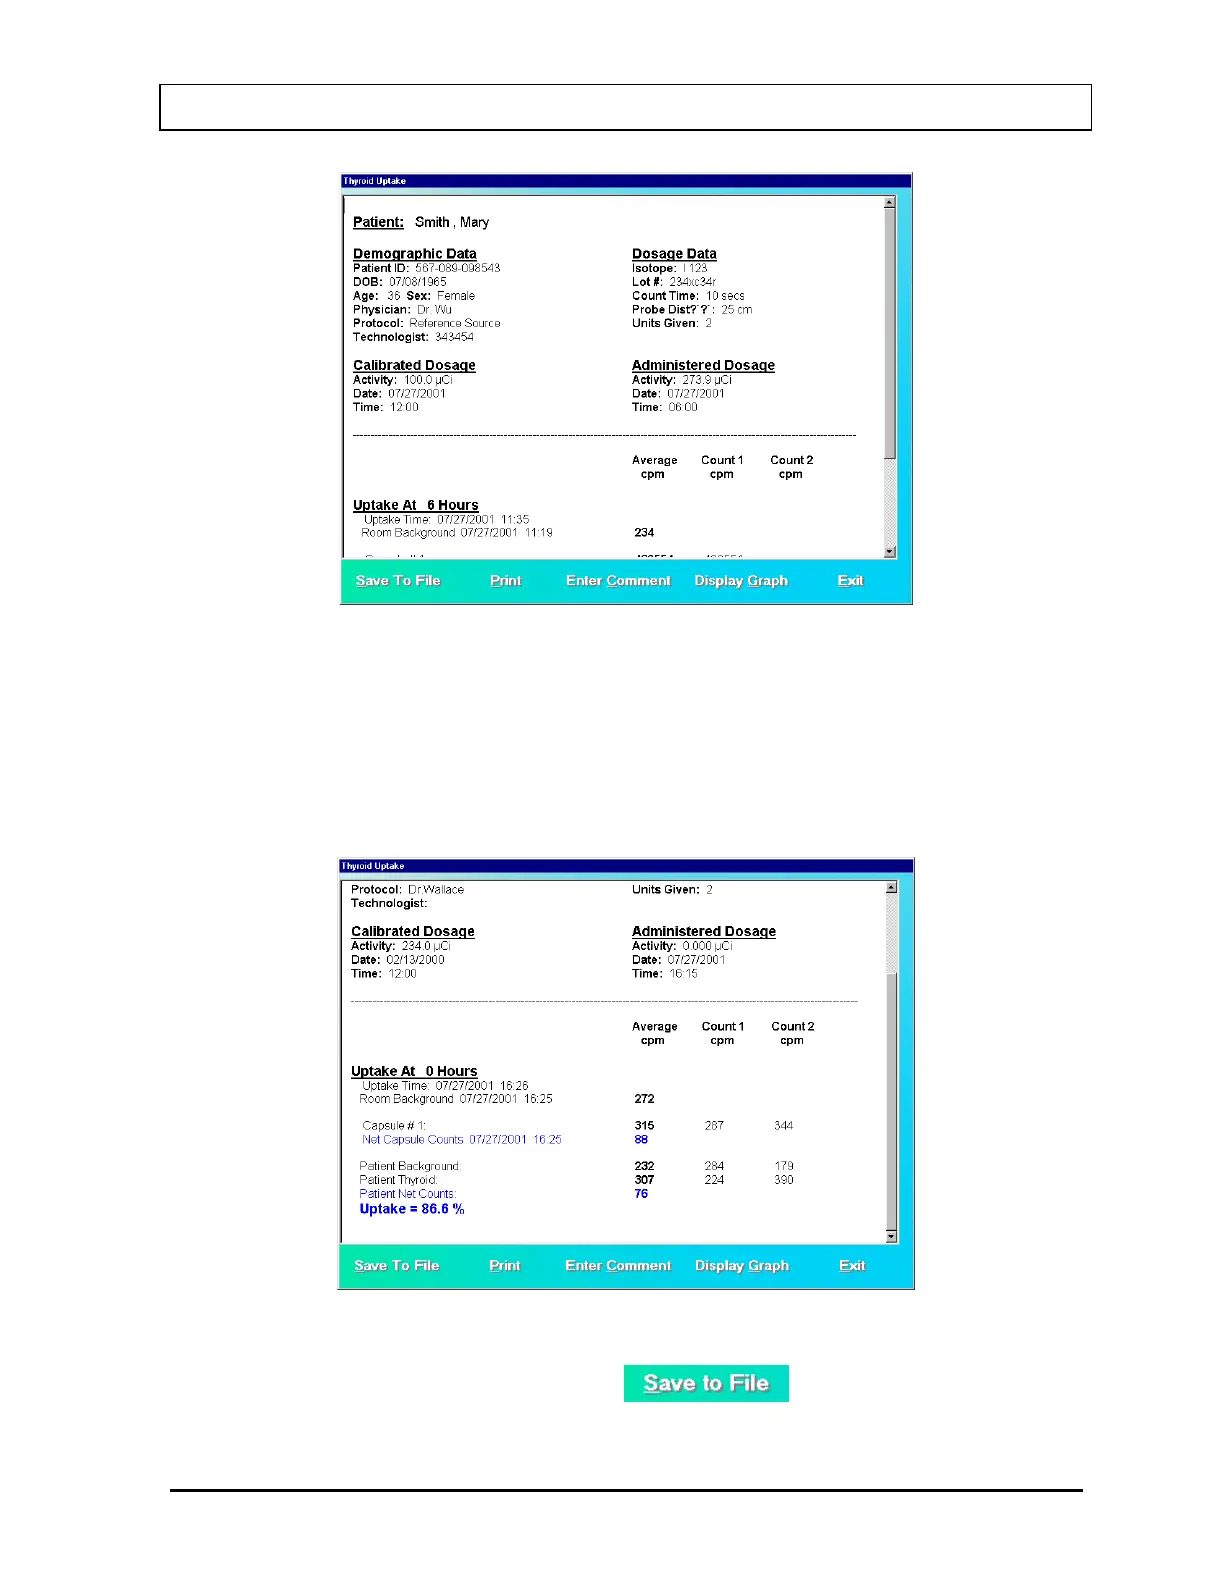
Figure 7-26
Using the scroll bars, scroll down the report screen to view the complete report. As
shown in Figure 7-27, the results appear for each uptake time, depending on the protocol
used. In this particular example, the background counts and the counts measured for two
capsules, each capsule for two repetitions and their average is shown. This average is
used for calculations. Next, the measured patient background counts and neck counts
appear. The calculated uptake percentage at that uptake time appears in bold blue.
Figure 7-27
4. To save the report on the screen, click the
button or press Alt+S. The
Save As box appears as shown in Figure 7-28. Reports are saved as rich text format file
November 13 THYROID UPTAKE 7-25
 Loading...