CAPINTEC, INC. CAPTUS
®
3000
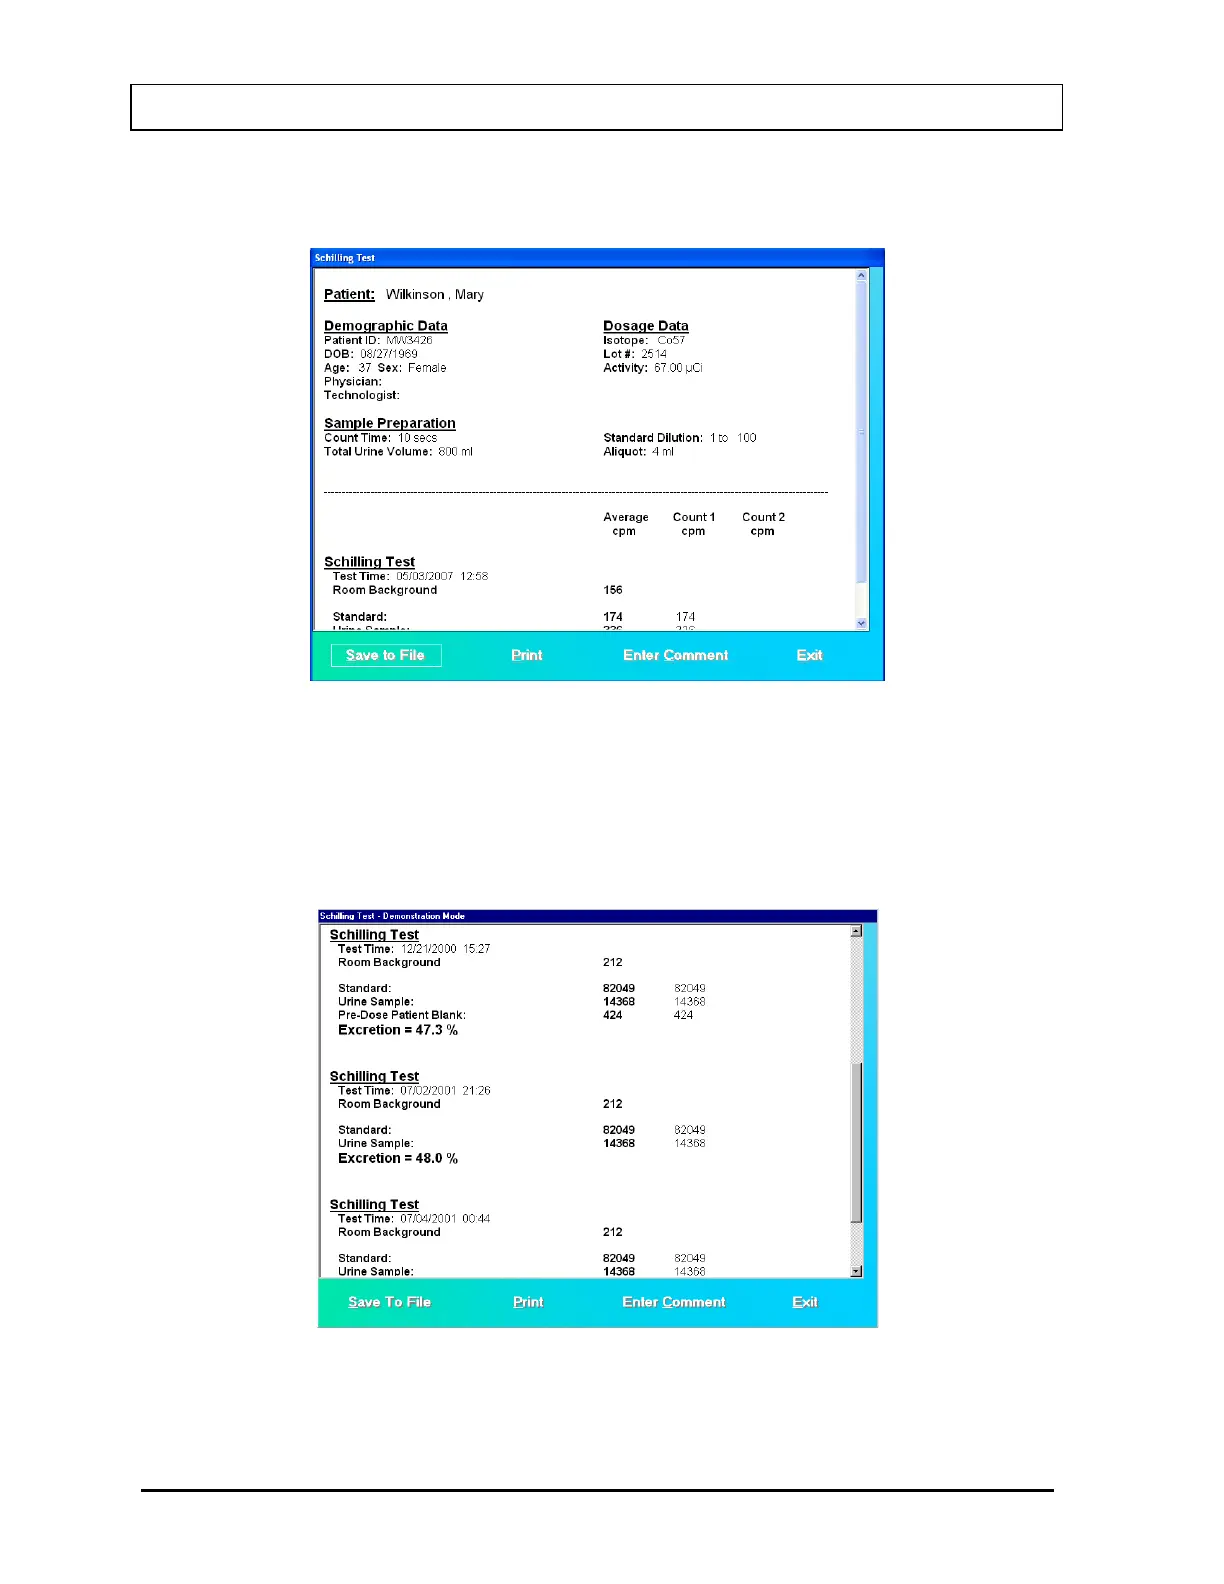
entered in the setup, then the normal ranges will also be printed. Any results outside
of these limits will be flagged in red.
Figure 10-23
Scroll down the report screen to view the complete report. As shown in Figure 10-24,
the results appear for each test performed, showing the time that the test was
performed. If counting was repeated for a measurement, Count 1, Count 2 and their
average are shown. This average is used for calculations. The calculated excretion
appears at the end of each test.
Figure 10-24
10-16 LAB TESTS November 13