App-18
IM 701210-06E
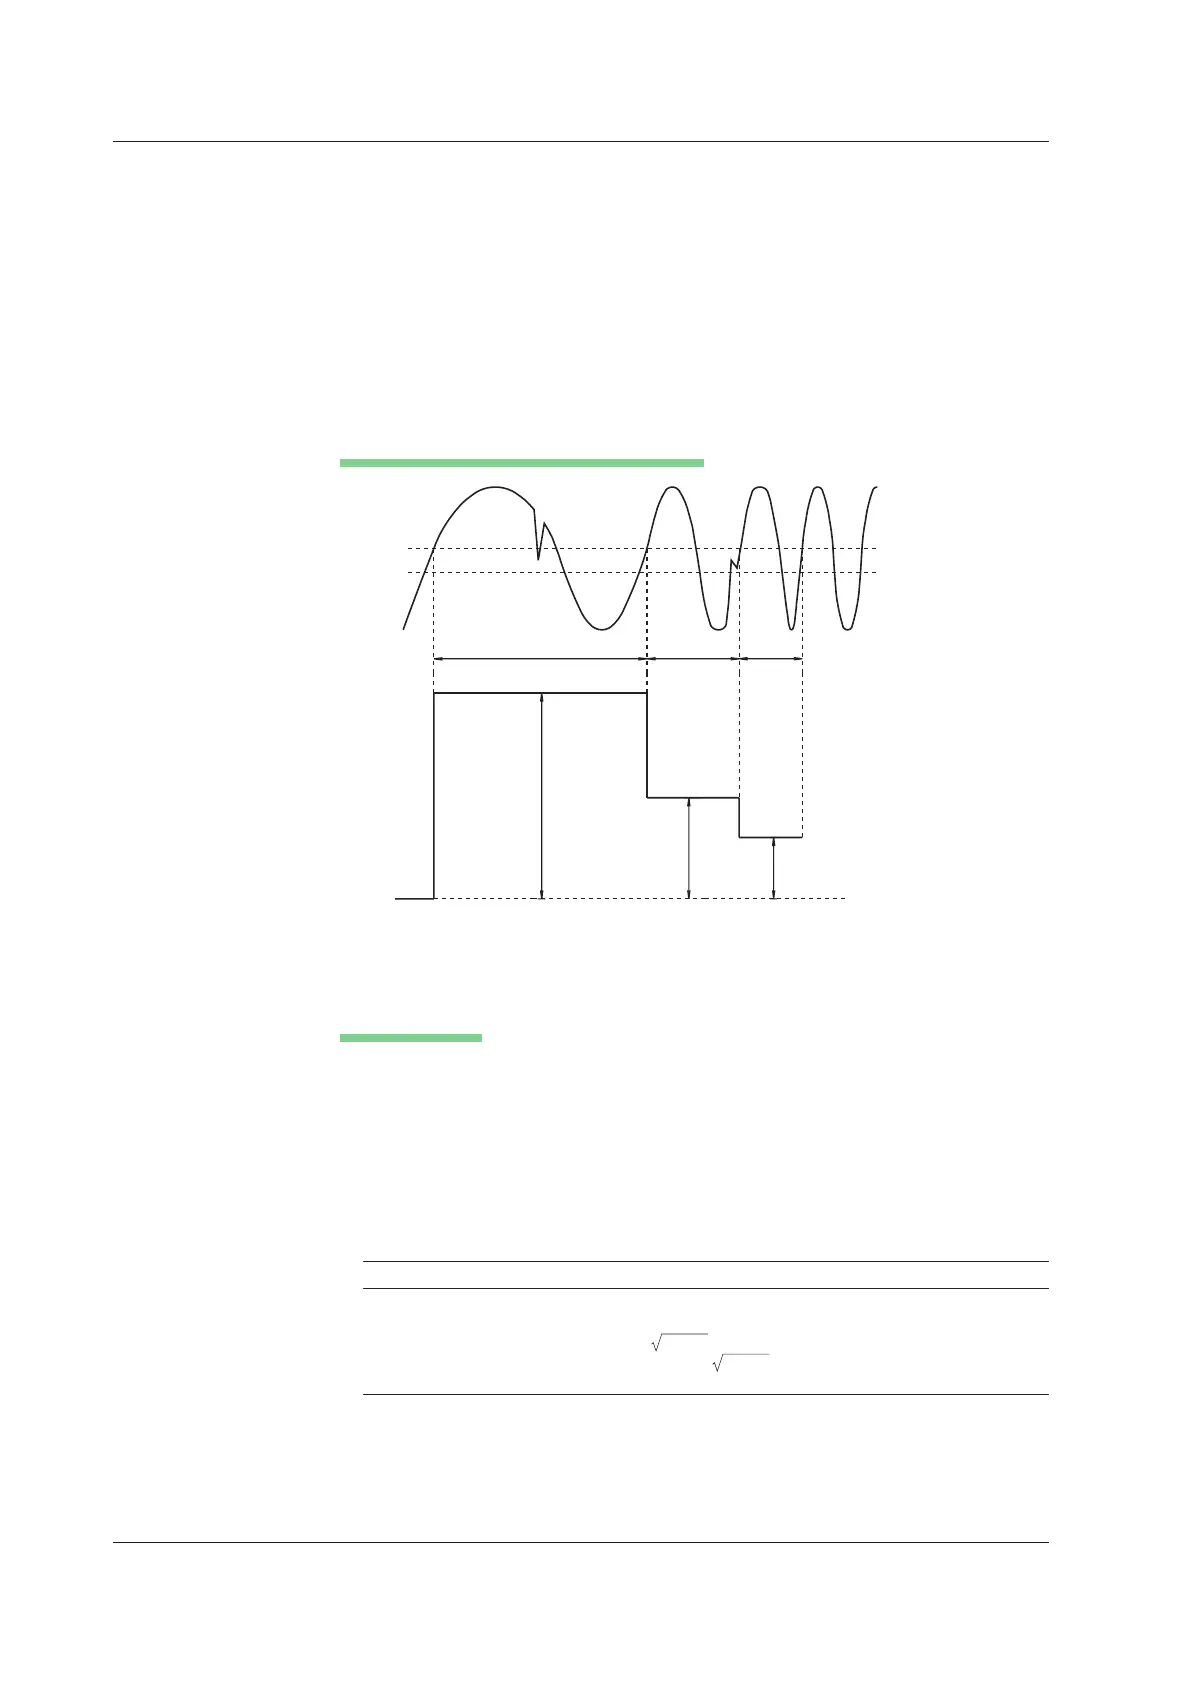
Pulse Width Computation
The signal is converted to binary values by comparing to a preset threshold level, and
the time of the pulse width is plotted as the Y-axis value for that interval.
The following 4 intervals are available.
PWHH From the rising edge to the next rising edge.
PWHL From the rising edge to the next falling edge.
PWLH From the falling edge to the next rising edge.
PWLL From the falling edge to the next falling edge.
PWXX From the rising or falling edge to the next rising or falling edge.
FV Inverse of PWHH
Example When the Interval Is Set to PWHH
Curve to
be computed
Upper threshold level
t1
t1
t2
t2
t3
t3
Computed result
Lower threshold level
FFT Function
Each frequency component G of a linear spectrum is represented by
G=R+jI (R: real part, I: imaginary part).
Linear Spectrum
Linear spectrum is a spectrum that can be directly determined with the FFT. The
magnitude and phase of each frequency component included in the measured waveform
can be found. The power spectrum and cross spectrum can also be determined from
one or two linear spectrums.
Because the FFT is a complex function, the linear spectrum produces the real part and
imaginary part of the frequency components. The magnitude and phase of the linear
spectrum can also be determined from the result.
The following spectrums can be determined with this instrument.
Item Equation Computation
Real part LS-REAL R
Imaginary part LS-IMAG I
Magnitude LS-MAG
(R
2
+I
2
)
Log magnitude LS-LOGMAG 20 × log
(R
2
+I
2
)
Phase LS-PHASE tan
–1
(I/R)
Log magnitude reference (0 dB): 1 Vpeak
Appendix 5 User-Defined Computation
 Loading...