ECG Monitoring
8-25
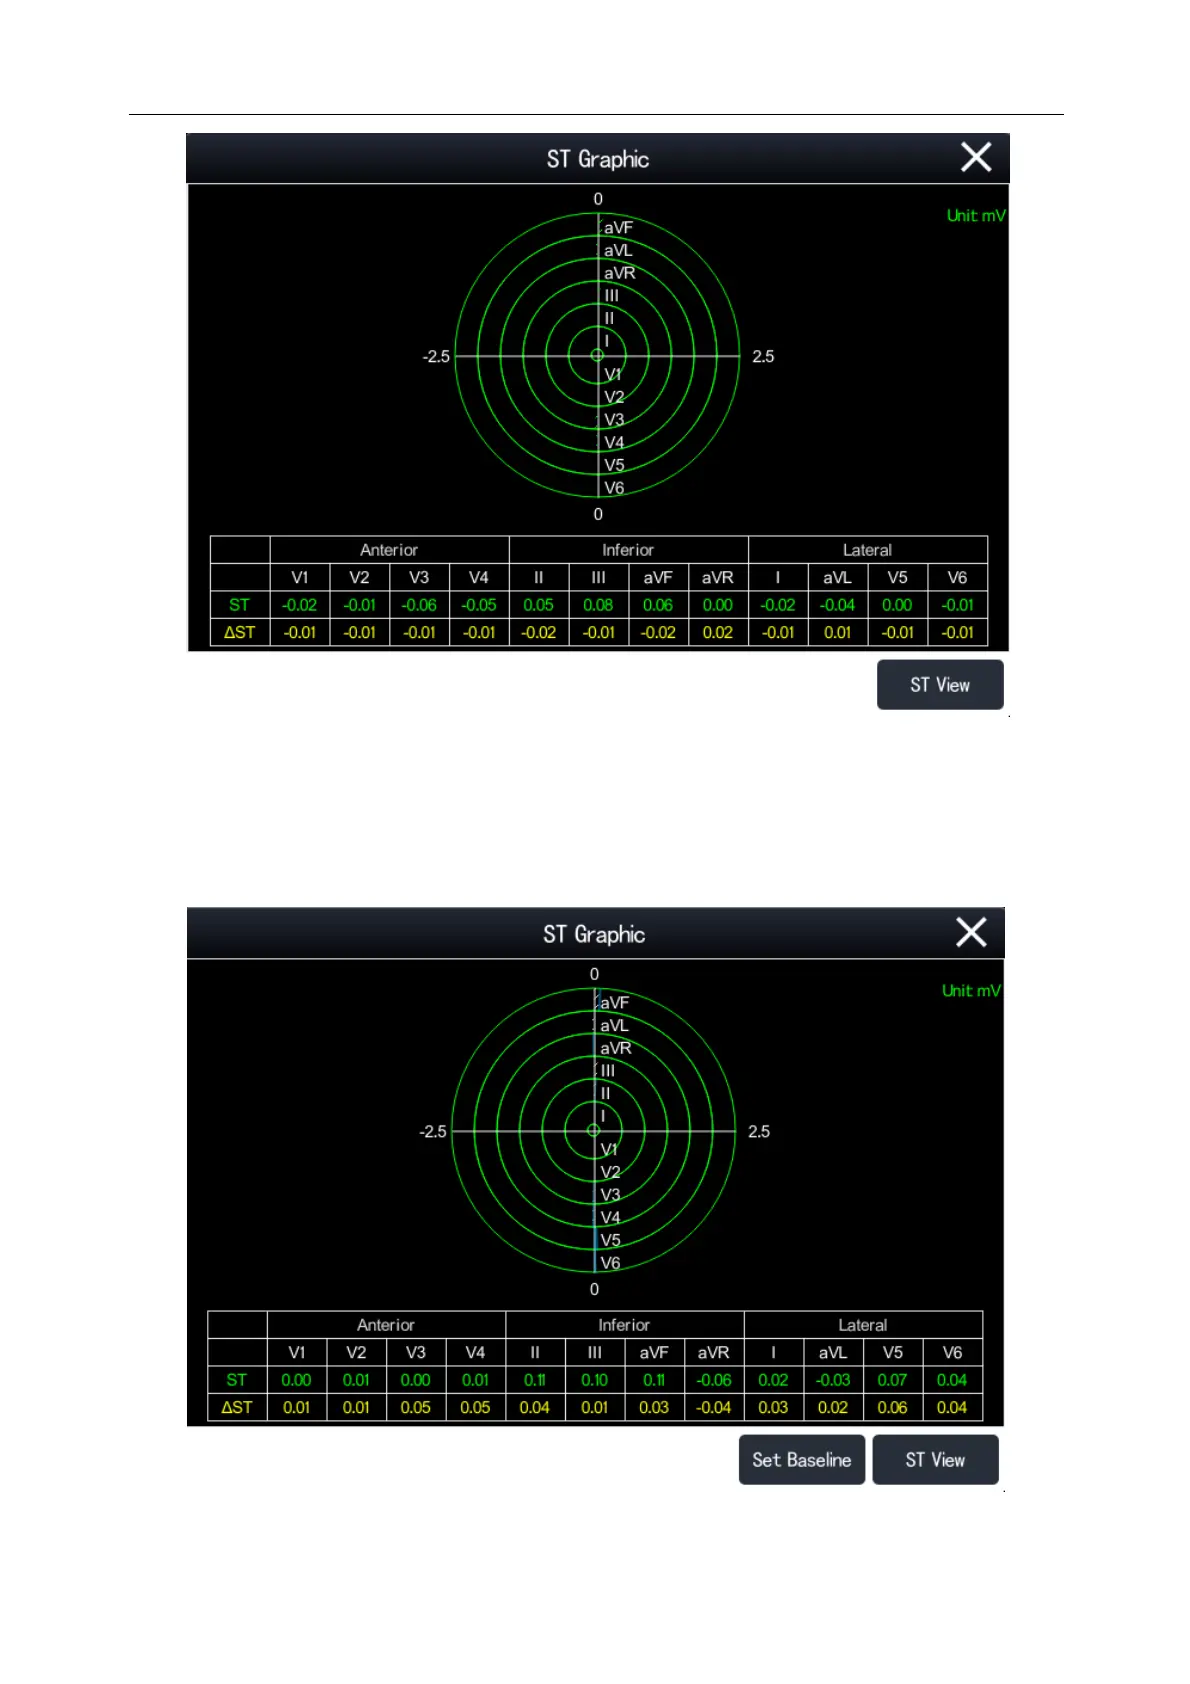
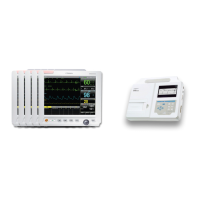
The figure below shows the ST Graphic when [ST Alarm Mode] is set to [Relative]. The grey diagonal line’s drawing
indicates the ST real-time value. The vertical center axis is 0mV. When the ST value is in the range of 0~2.5mV, it is
drawn from the vertical center axis anticlockwise to the right. When the ST value is in the range of -2.5mV~0, it is
drawn from the vertical axis clockwise to the left. The blue drawing parts indicates ΔST value, it starts from the ST
baseline end position. When ΔST>0, it is drawn anticlockwise. When ΔST<0, it is drawn clockwise: