Clinical Assistant Assessment (CAA)
17-2
(5) Button area.
(6) Slider: indicates the position of the current screen as part of the full time period. You can move the slider left
or right to locate the trend data at a specific time, and the trend data displayed in the current screen will be
updated accordingly.
(7) Waveform area: displays the trend curve of parameters. The trend curve is displayed in the same color as the
corresponding parameter name.
(8) Current window time bar: indicates the time range of the current window.
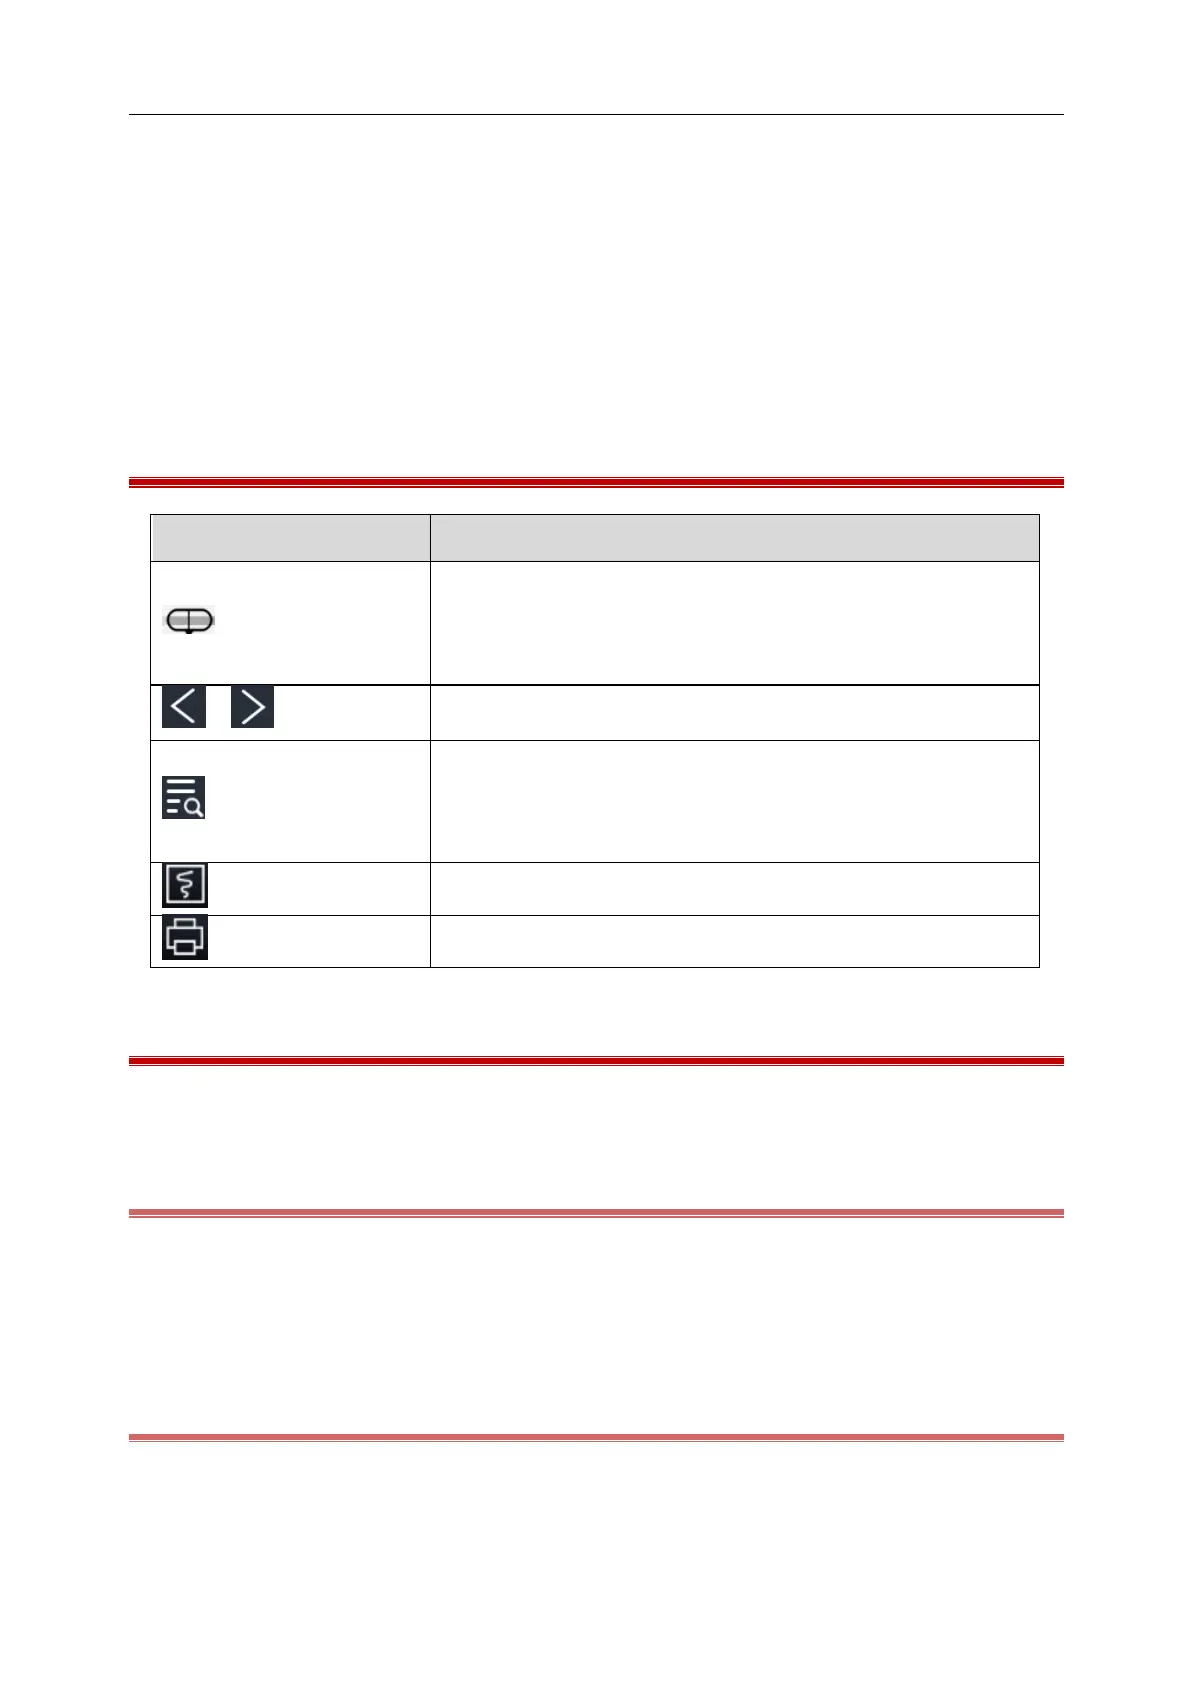
17.3 Icons on the Review Screen
Slider: indicates the position of the current screen as part of the full time
period. You can move the slider left or right to locate the trend data at a
specific time, and the trend data displayed in the current window will be
updated accordingly.
Locate the previous or next event.
Event list: displays events in the order of the time they occurred. The
event that occurred at the last moment is displayed at the top of the list.
The number of "*" marks in front of the event indicates the Alarm
Priority.
Record button: click it to output data through the recorder.
Print button: click it to output data through the external printer.
17.4 Tabular Trends
Tabular trends are a table of patient data displayed over time.
17.4.1 Go to the Tabular Trends Page
Follow either path described below to go to the Tabular Trends page:
Click [Review] hot key → [Tabular Trends] tab; or
Click [Main Menu] hot key → [Review] → [Tabular Trends].
17.4.2 Select the Trend Group
Set the [Trend Group] on the [Tabular Trends] page.