ECG Monitoring
8-17
8.6.2 View HRV Parameters
1) Select the ECG parameter area or waveform area to enter [ECG] menu.
2) Select [Setup] tab and then [HRV] button at the bottom of the menu to enter HRV menu.
3) Select [Parameter] tab.
Mean value of RR intervals
Standard deviation of the averages of RR intervals for all 5-minute
segments
Standard deviation of the RR intervals of all sinus heart beats
Standard deviation of the RR intervals for all 5-minute segments
Root mean square of the successive differences
The number of pairs of successive NN intervals that differ by more
than 50ms
The proportion of NN50 divided by the total number of NN
intervals
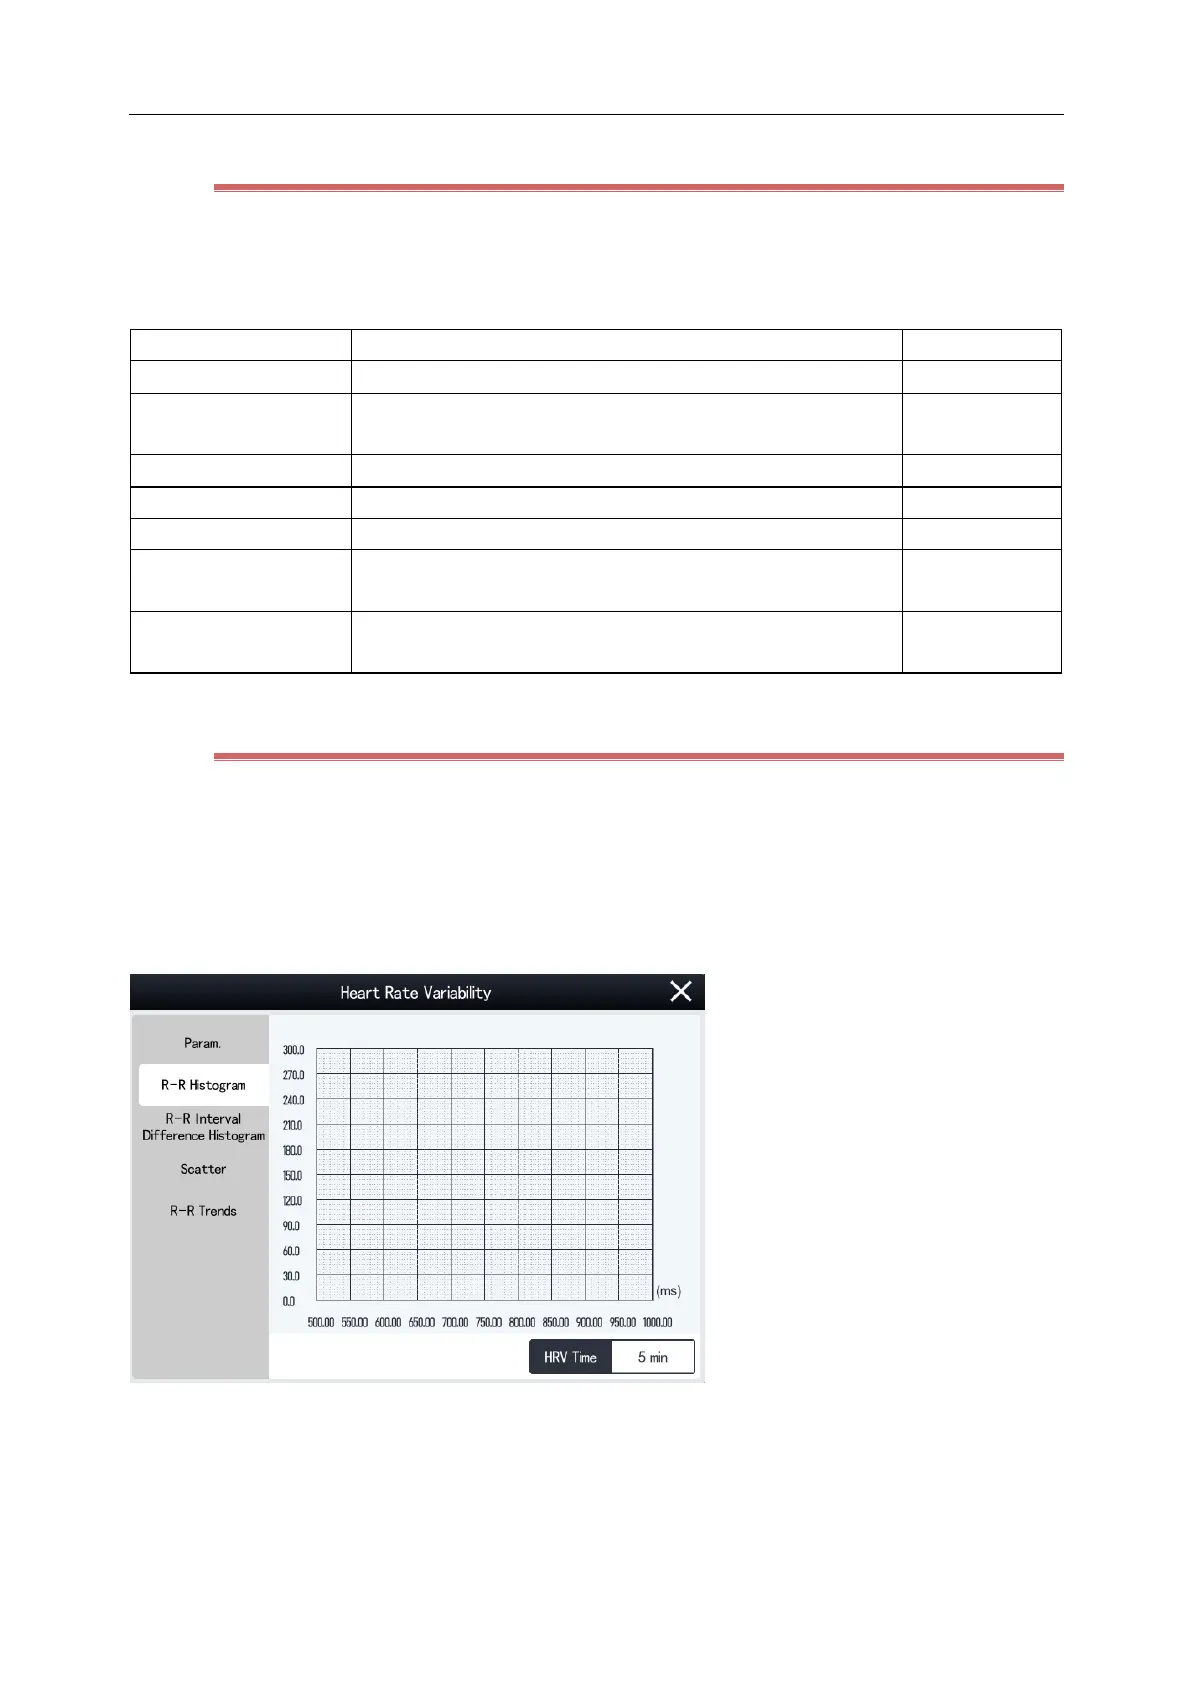
8.6.3 View Histogram R-R
Histogram R-R reflects the distribution and proportion of RR interval values. Steps to view the histogram are as
follows:
1) Select the ECG parameter area or waveform area to enter [ECG] menu.
2) Select [Setup] tab and then [HRV] button at the bottom of the menu to enter [HRV] menu.
3) Select [Histogram R-R] tab.
The x-coordinate indicates the time value of RR intervals.
The y-coordinate indicates the number of RR intervals.