ECG Monitoring
8-19
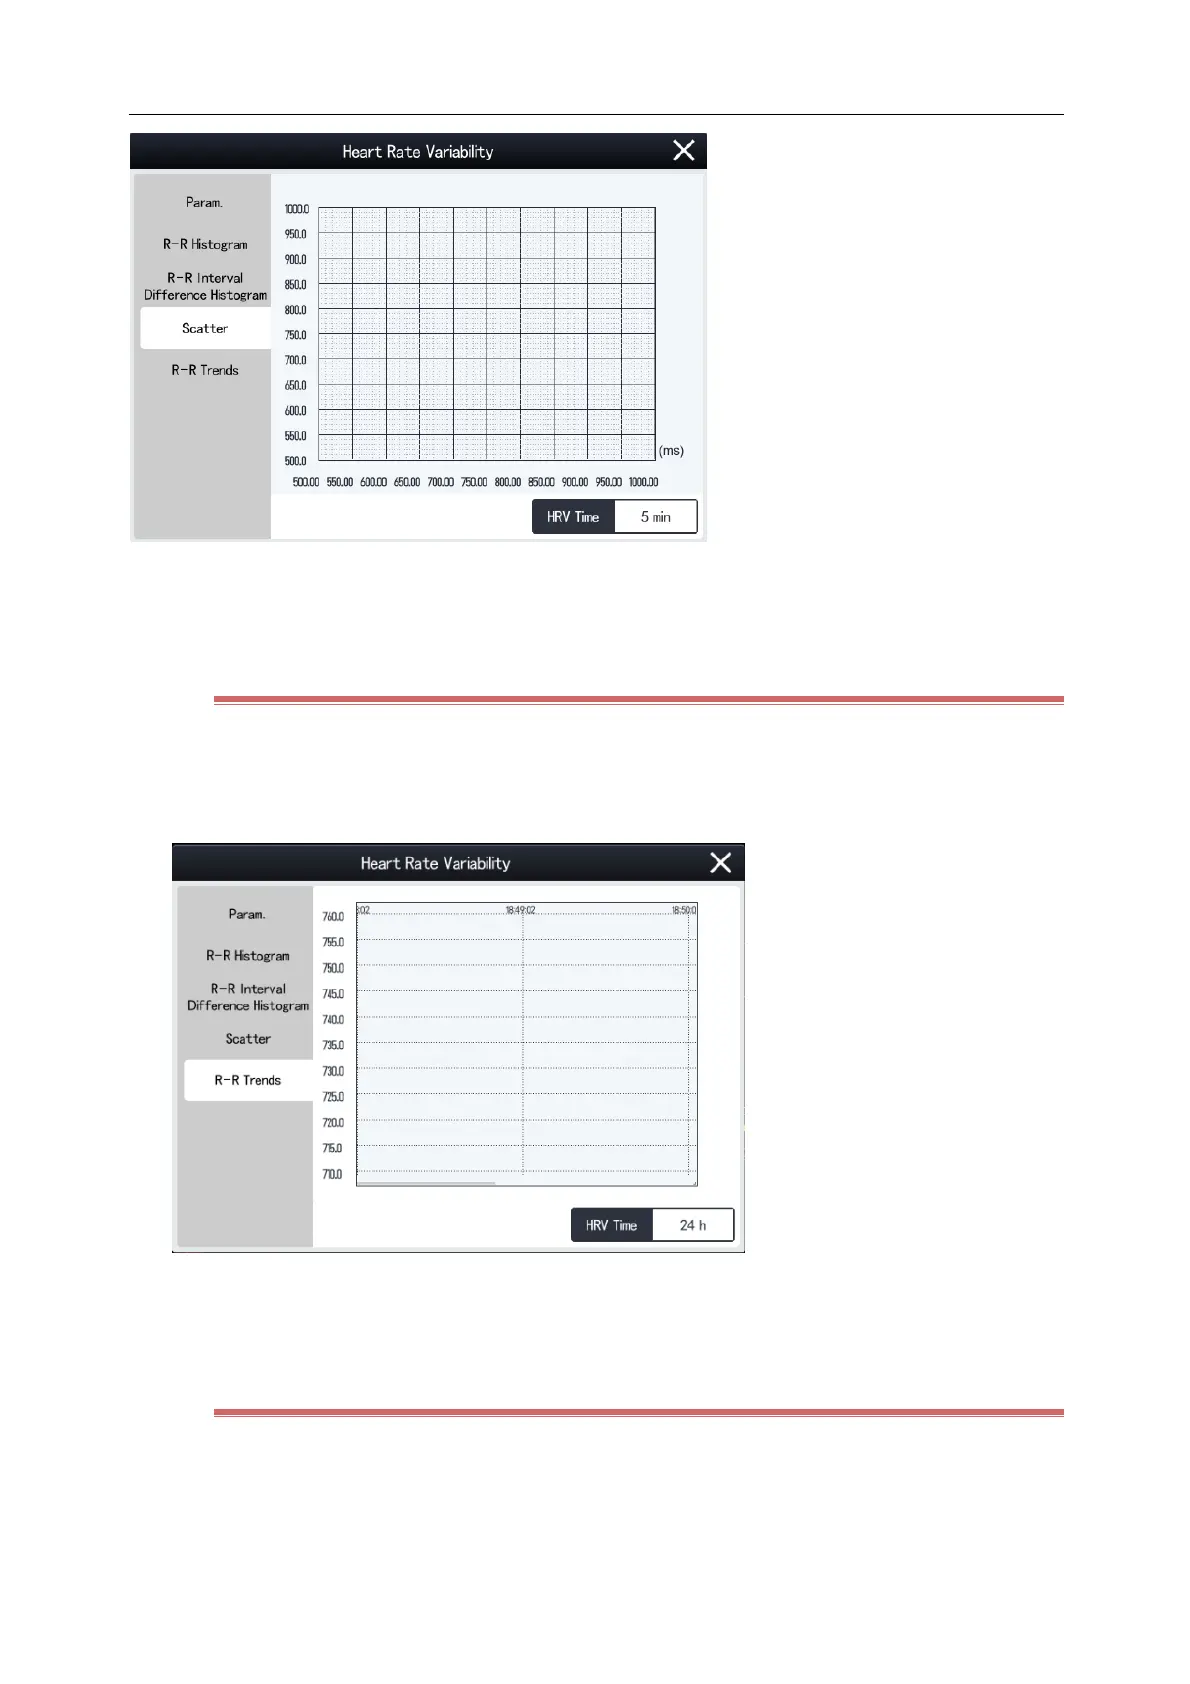
The x-coordinate indicates an R-R interval.
The y-coordinate indicates the next R-R interval.
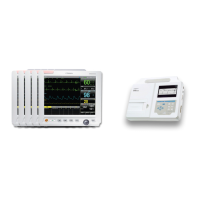
8.6.6 View R-R Trend
1) Select the ECG parameter area or waveform area to enter [ECG] menu.
2) Select [Setup] tab and then [HRV] button at the bottom of the menu to enter [HRV] menu.
3) Select [R-R Trend] tab.
The x-coordinate indicates the time.
The y-coordinate indicates the mean value of RR intervals within the time period.
8.6.7 Select Analysis Period
The Monitor saves the latest HRV data up to a maximum of 24 hours. You can select the data of a certain period to
draw Histogram R-R, Difference Histogram R-R, Scatter and R-R Trend. Steps are as follows:
1) Select the ECG parameter area or waveform area to enter [ECG] menu.