ECG Monitoring
8-18
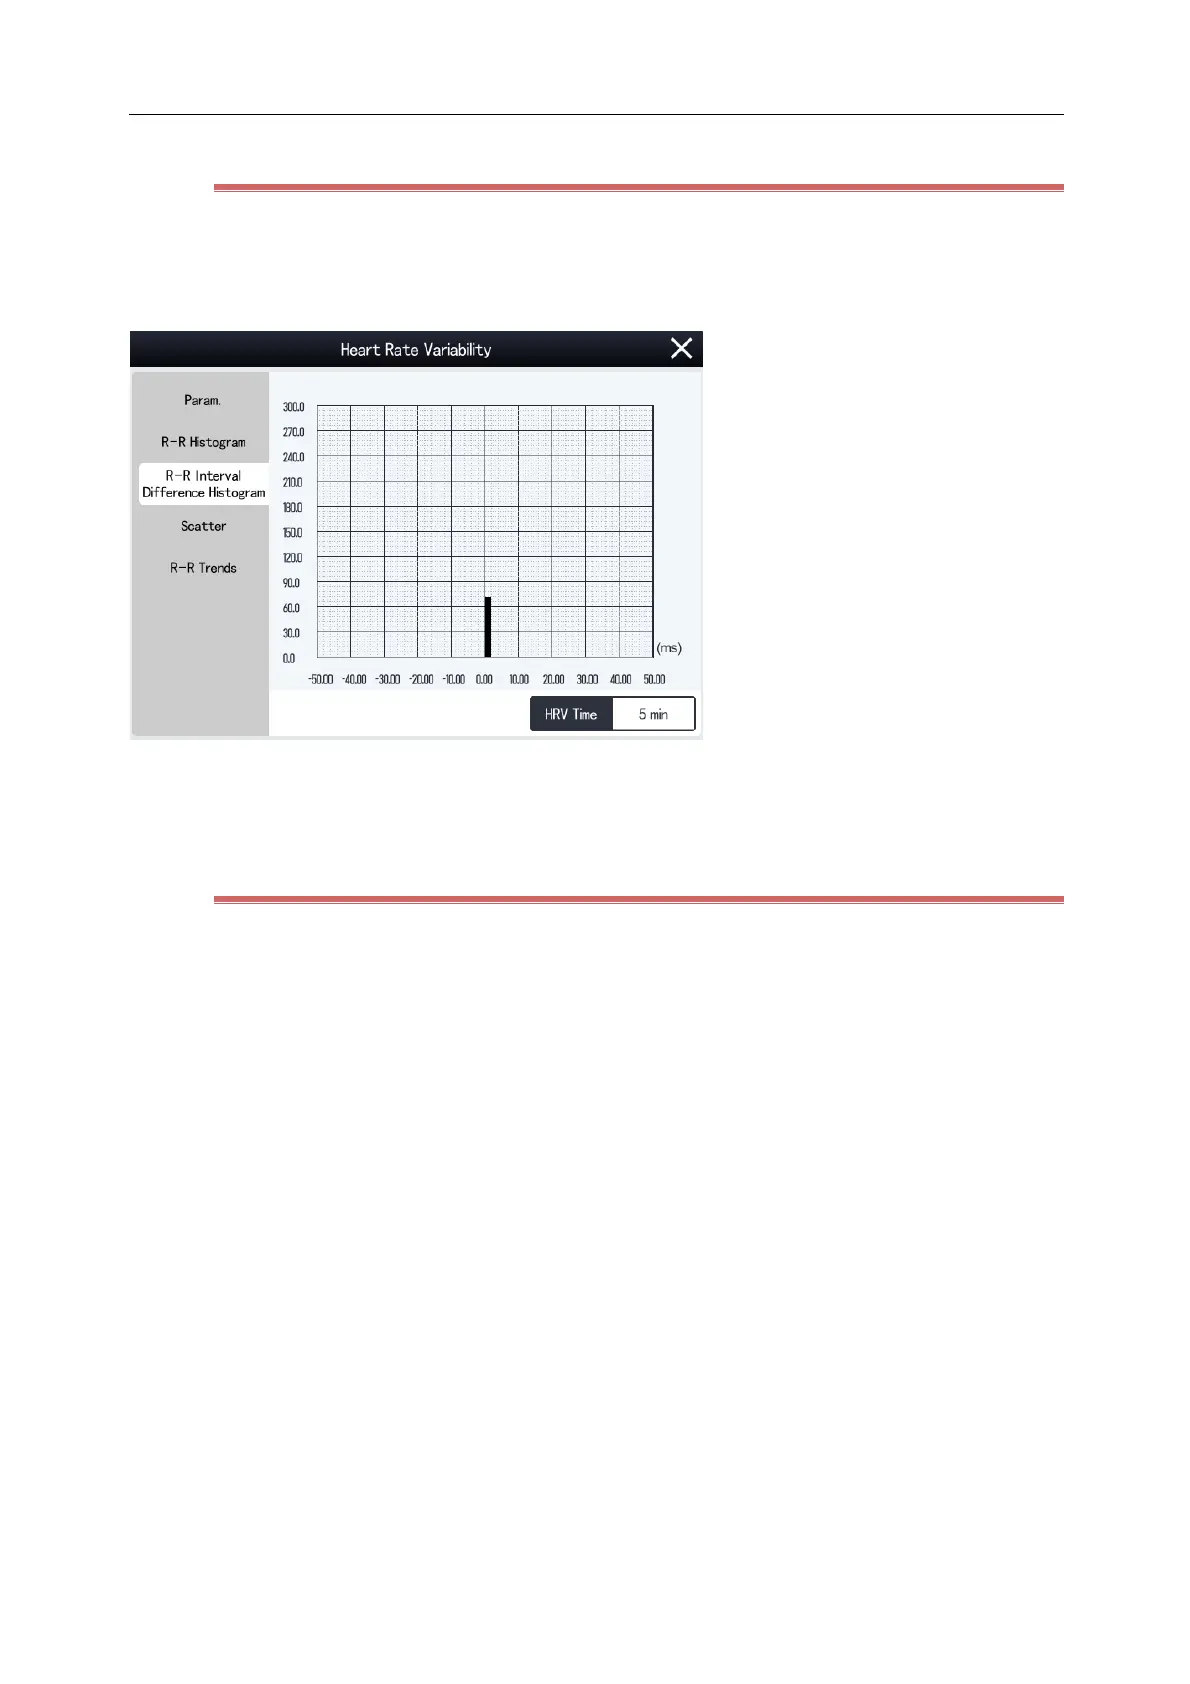
8.6.4 View Difference Histogram R-R
1) Select the ECG parameter area or waveform area to enter [ECG] menu.
2) Select [Setup] tab and then [HRV] button at the bottom of the menu to enter [HRV] menu.
3) Select [Difference Histogram R-R] tab.
The x-coordinate indicates the differences of successive RR intervals.
The y-coordinate indicates the number of RR intervals.
8.6.5 View Scatter
The scatter contains the linear and nonlinear trends of HRV, gives a visual display of heartbeats and reveals
nonlinear processes and aperiodic movements. The density of dots is expressed by the depth of the color (blue (low)
~ red (high)).
1) Select the ECG parameter area or waveform area to enter [ECG] menu.
2) Select [Setup] tab and then [HRV] button at the bottom of the menu to enter [HRV] menu.
3) Select [Scatter] tab.