ECG Monitoring
8-22
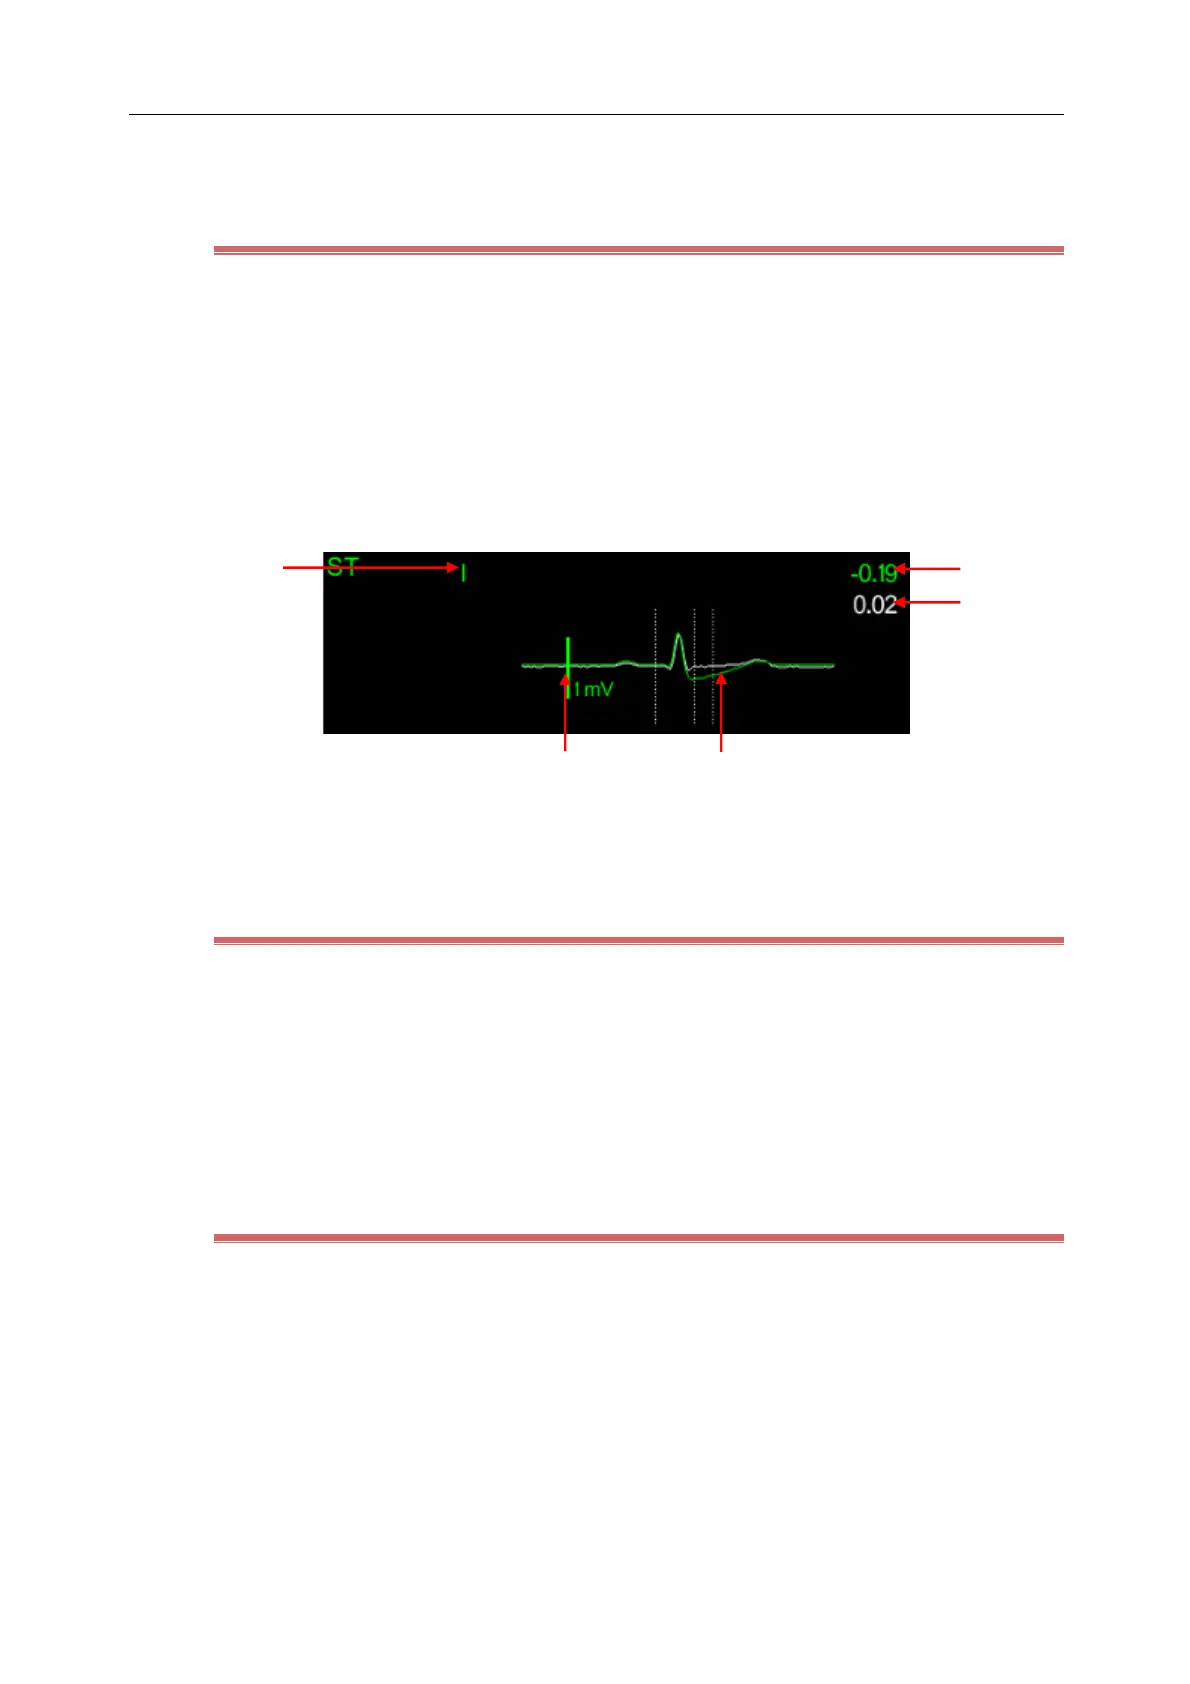
(4) Lead name (5) ST value:a positive number indicates ST elevation and negative for ST depression
8.7.6 Display ST Segment in Waveform area
1) Enter the [Tile Layout] screen in any of the following ways:
Select [Screen Setup] hot key → [Tile Layout]
Select [Main Menu] hot key → [Display] → [Tile Layout].
2) Click on the waveform area to display ST segment and then select [ECG] → [ST Segment]。
The ST waveform area displays the current ST segment waveform and baseline waveform, the current ST value and
the baseline value. Typically, the current ST segment and parameter values are displayed in green, and the baseline
segment and parameter values are displayed in white.
(1) ST lead (2) ST value (3) ST baseline value
(4)1mV marker (5) ST segment(green)and ST baseline(white)
8.7.7 Select ST Segment Analysis Lead in Waveform area
The Monitor displays the result of three lead ST segments analysis with the maximum change amplitude by default.
You can manually select the lead as shown below:
1) Select the ECG parameter area, waveform area or ST parameter area to enter [ECG] menu.
2) Select [ST] tab → [Setup] tab.
3) Select [ST Segment] to set the lead to be displayed. You can select ST segments of up to three leads to display.
8.7.8 Display Position Markers of ISO Point, J Point and ST Point
Position markers of ISO point, J point and ST point are not displayed in ST segment by default. If you want to show
these markers, follow the steps below:
1) Select the ECG parameter area, waveform area or ST parameter area to enter [ECG] menu.
2) Select [ST] tab → [Setup] tab.
3) Turn on the [Show Markers] switch.