8 Glovebox or enclosure operation
Monitoring gas concentration
Page
8 - 6
MB-20-G/MB-200G-W_MB-LABmaster_MB-200 MOD_TP700
Operating Manual - V5.0 - 04/2018 - STD
Information bar on upper
edge of the touch panel.
The O
2
and H
2
O analyser
readings are displayed on
the information bar.
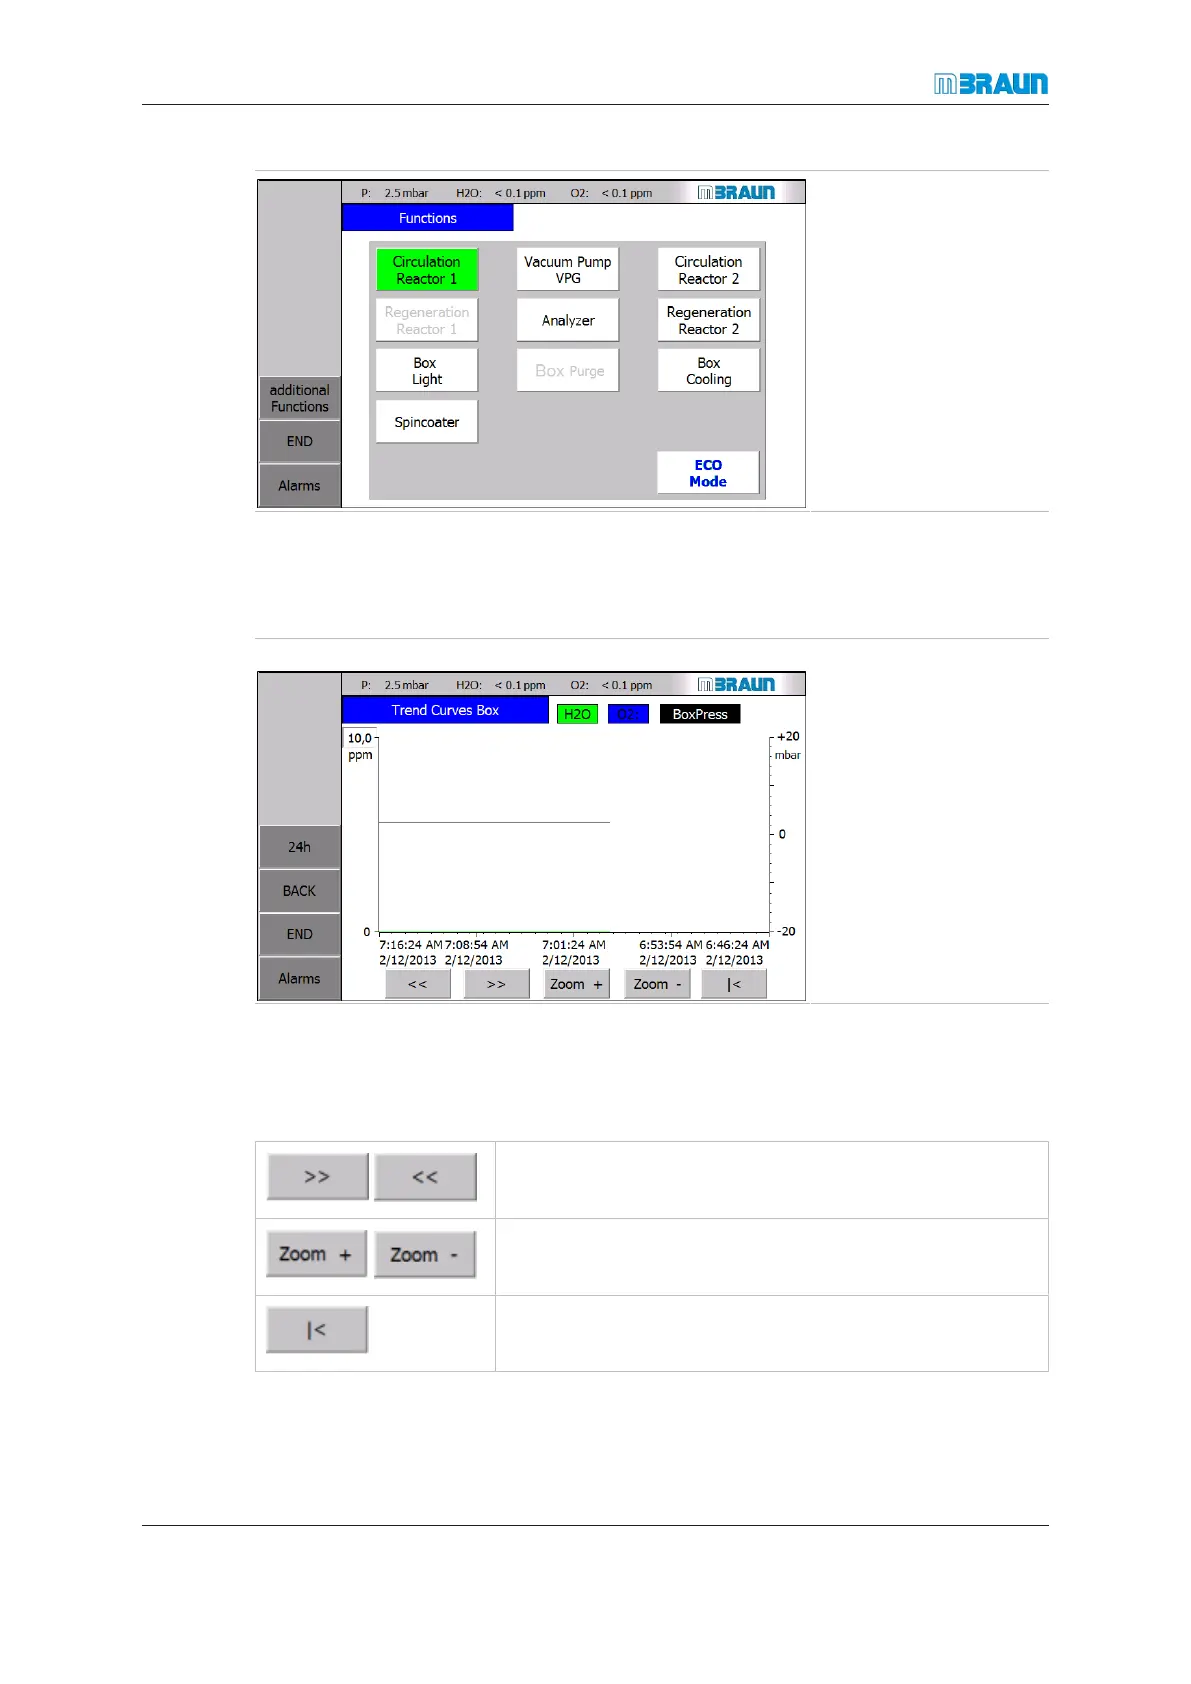
8.5.2 Glovebox trend screen
The glovebox trend screen provides trend curves for H
2
O, O
2
concentration and box pres-
sure (the display of other values is optional).
Start Screen ⇨ Menu ⇨ Box Trend Curves
H2O but-
ton
Trend for
H
2
O con-
centration
O2: button Trend for
O
2
con-
centration
BoxPress
button
Trend for
box pres-
sure
¡ X-axis: Time scale
¡ Y-axis: Reading values in physical units (here: pressure in mbar)
Navigation
Shifts the time axis
Expands or compresses time axis
Returns to current time