This Reference Phase Offset Data is plotted over time (abscissa) in the Reference
Monitor panel in the center of the screen. Use the check boxes in the References
panel (2) to select the reference(s) for which you want to plot the phase offset
data. Use the handles (3) to zoom in on a time window.
The scale of the axis of ordinate (4) is determined by the largest amplitude of any
of the references displayed in the current time window. Use the checkboxes in
the References panel on the right to remove references from the graph, or add
them to it.
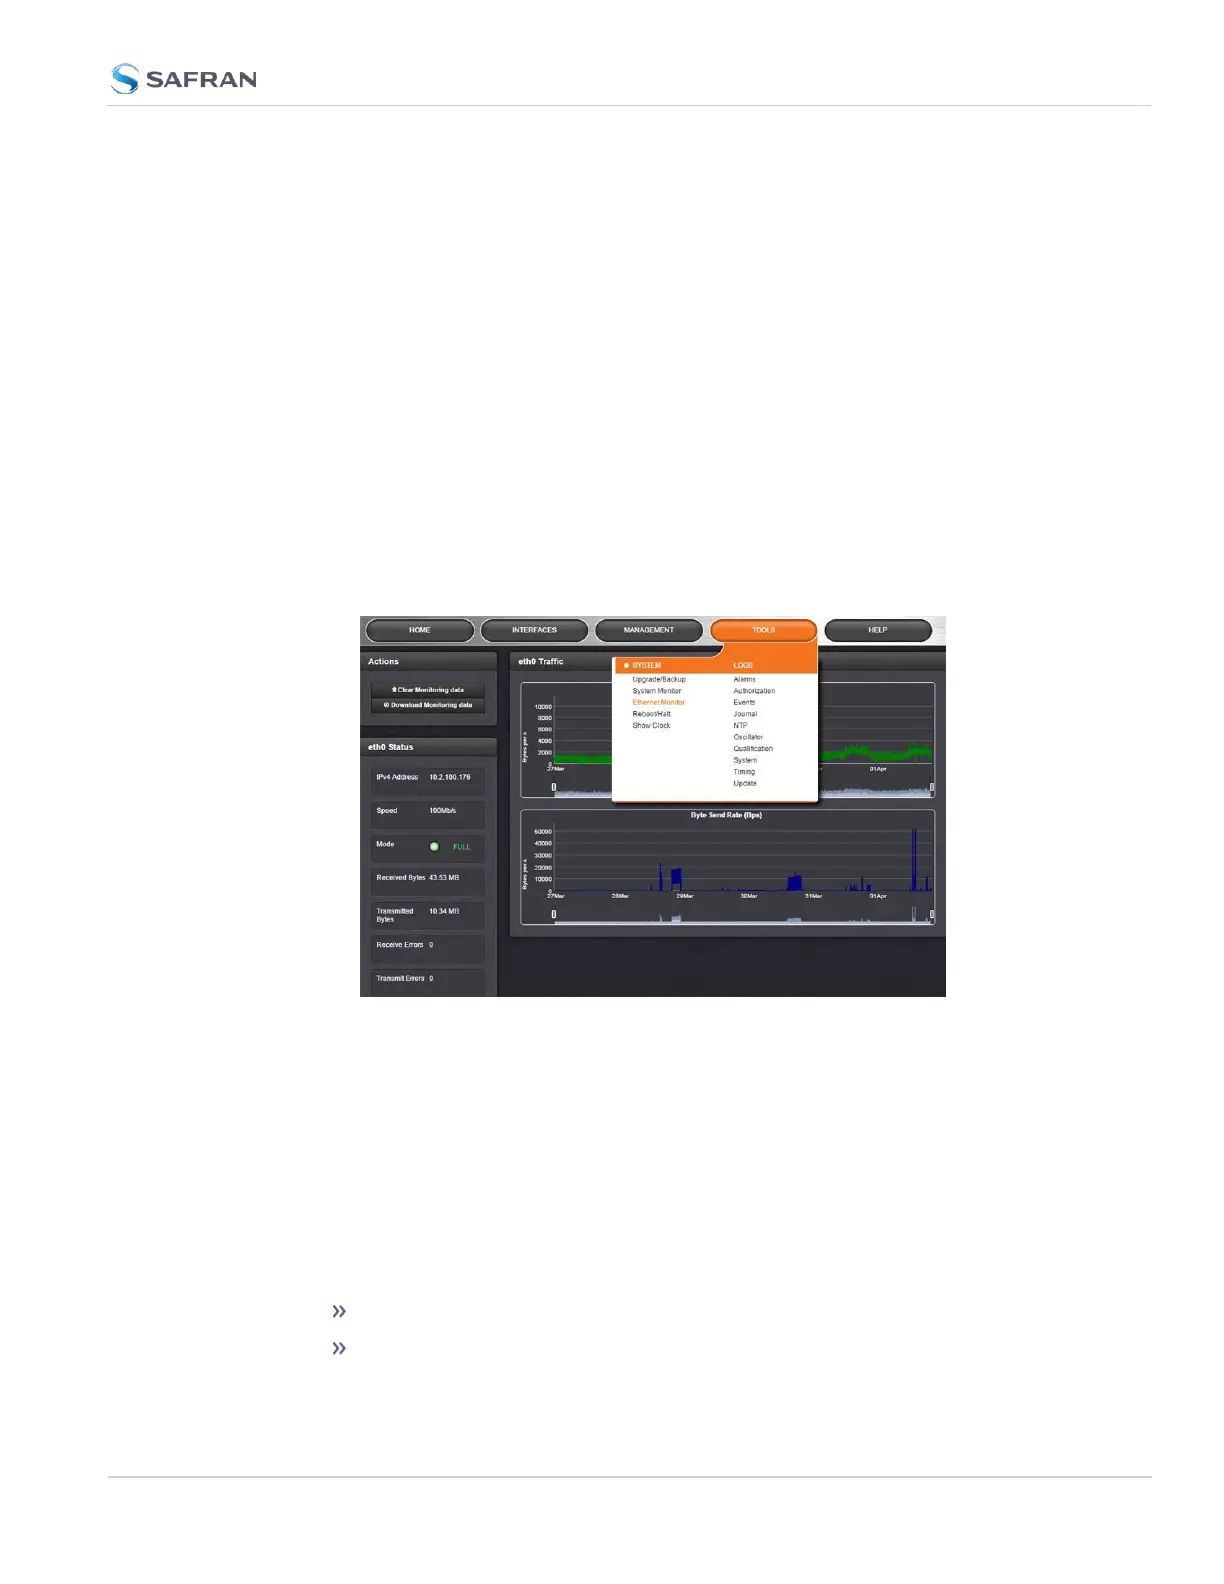
4.5.1.5 Ethernet Monitoring
To monitor Ethernet status and traffic:
1.
Navigate to TOOLS > SYSTEM: Ethernet Monitor. The Ethernet monitoring
screen opens:
The data displayed is linked to a specific Ethernet port e.g., ETH0. If you enable
additional Ethernet ports, their throughput data will also be displayed.
In the Traffic pane on the right the traffic throughput in Bytes per second is dis-
played in two graphs. Drag the handles at the bottom of the graphs to zoom in
on a particular time frame.
In the Actions panel on the left, you can clear or download monitoring data.
In the Status panel on the left, information pertaining to the given Ethernet port
is displayed, including throughput statistics and error statistics. The Mode field
indicates which transmission mode is being used for the given Ethernet port:
FULL duplex, or
HALF duplex.
4.5 Quality Management
CHAPTER 4 • SecureSync 2400 User Manual Rev. 5.2
309