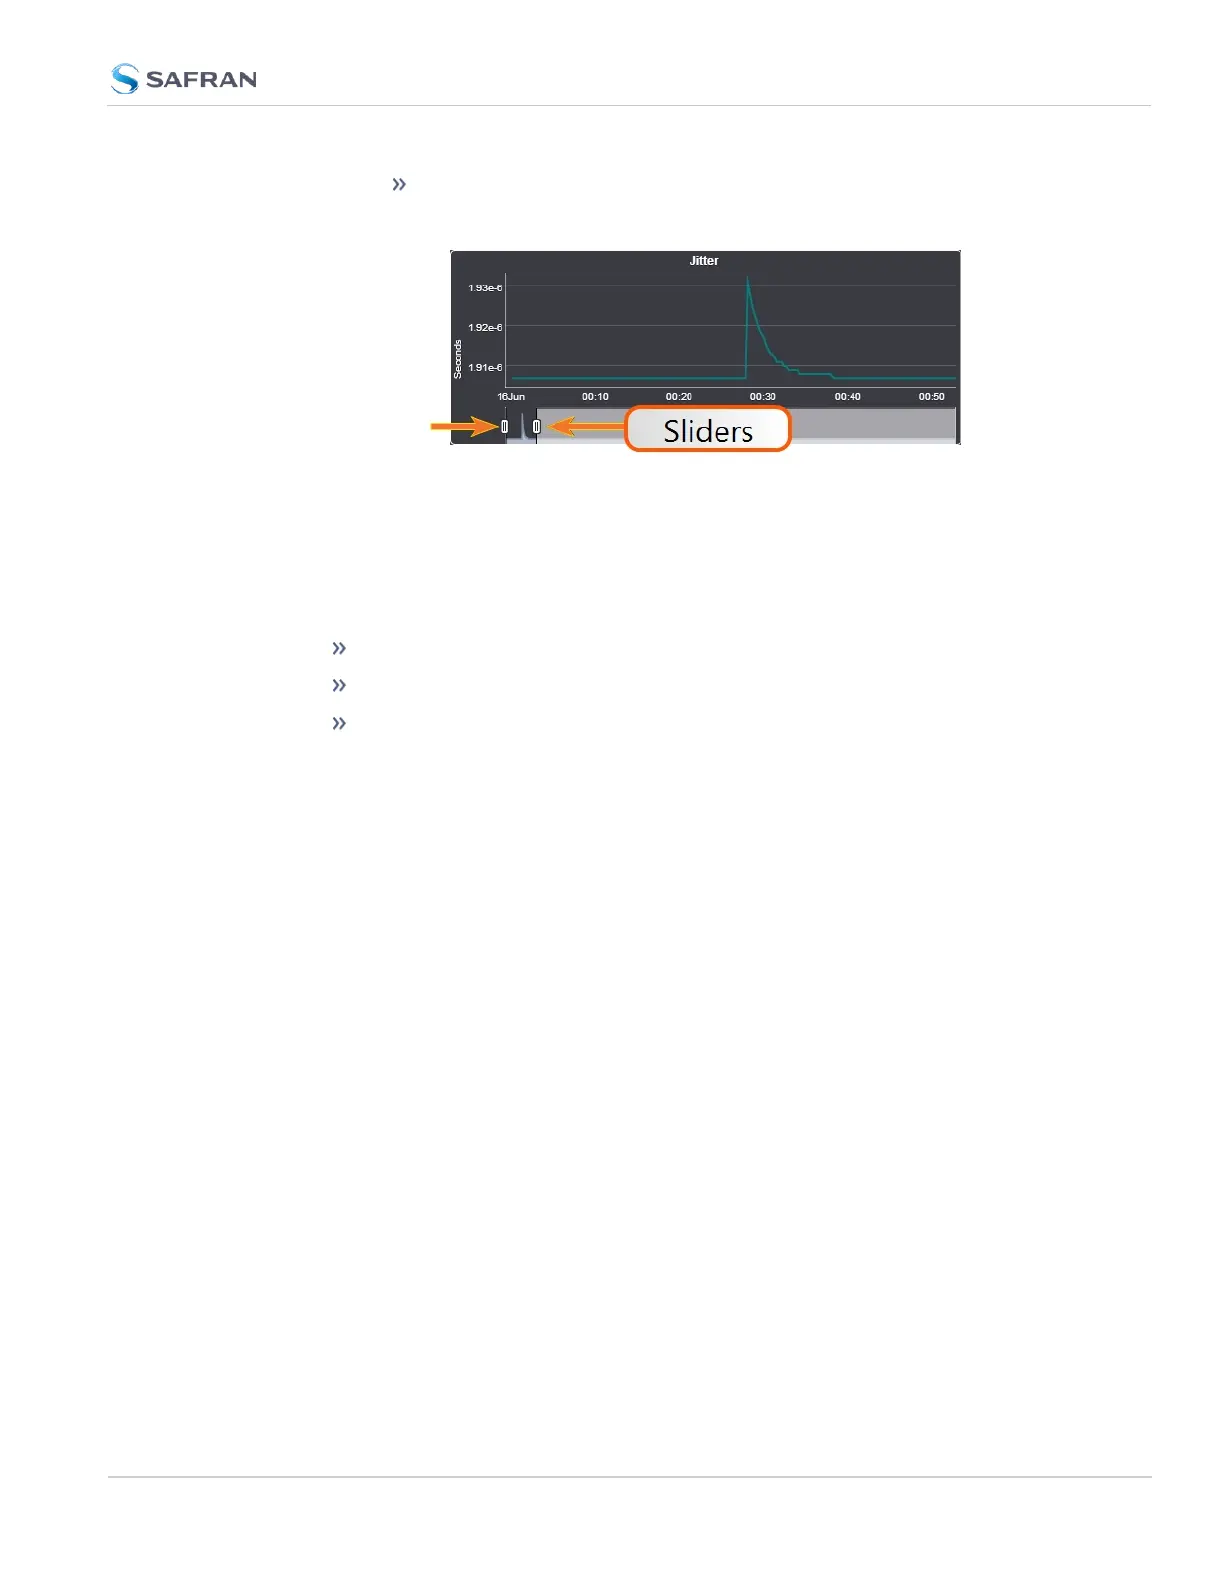
To display a higher resolution graph for a shorter time span, move
one or both time sliders at the bottom of the graph inwards.
4.5.1.10 Temperature Management
SecureSync is equipped with one cooling fan, located behind the right-hand side
of the front panel, and several hardware temperature sensors, including:
the board temperature near the CPU
the CPU temperature
the air temperature near the oscillator.
Temperature readings are performed once per minute. The temperature data is
logged, and can be visualized via graphs integrated into the WebUI. The tem-
perature readings can also be used to control the fan. For details see below under
Fan Control Feature.
Temperature Monitoring
You can monitor the unit's measured temperatures actively by inspecting the
temperature graphs in the Web UI, or passively by setting up automatic alarm
messages.
Alarm notifications can be generated via SNMP Traps and Emails, as well as log
messages in the Alarm and Event Logs. The alarms may optionally be masked.
Also, it is possible to implement a delay by setting the number of times the
1/minute readings need to exceed a temperature threshold before an alarm is
triggered.
Monitoring CPU and Board Temperature
Current readings for Oscillator/Board/CPU Temperature are displayed in the Sys-
tem Status panel, which can be accessed via the HOME screen, or via TOOLS >
System Monitor.
Board Temperature graphs are displayed under TOOLS > System Monitor:
4.5 Quality Management
CHAPTER 4 • SecureSync 2400 User Manual Rev. 5.2
323