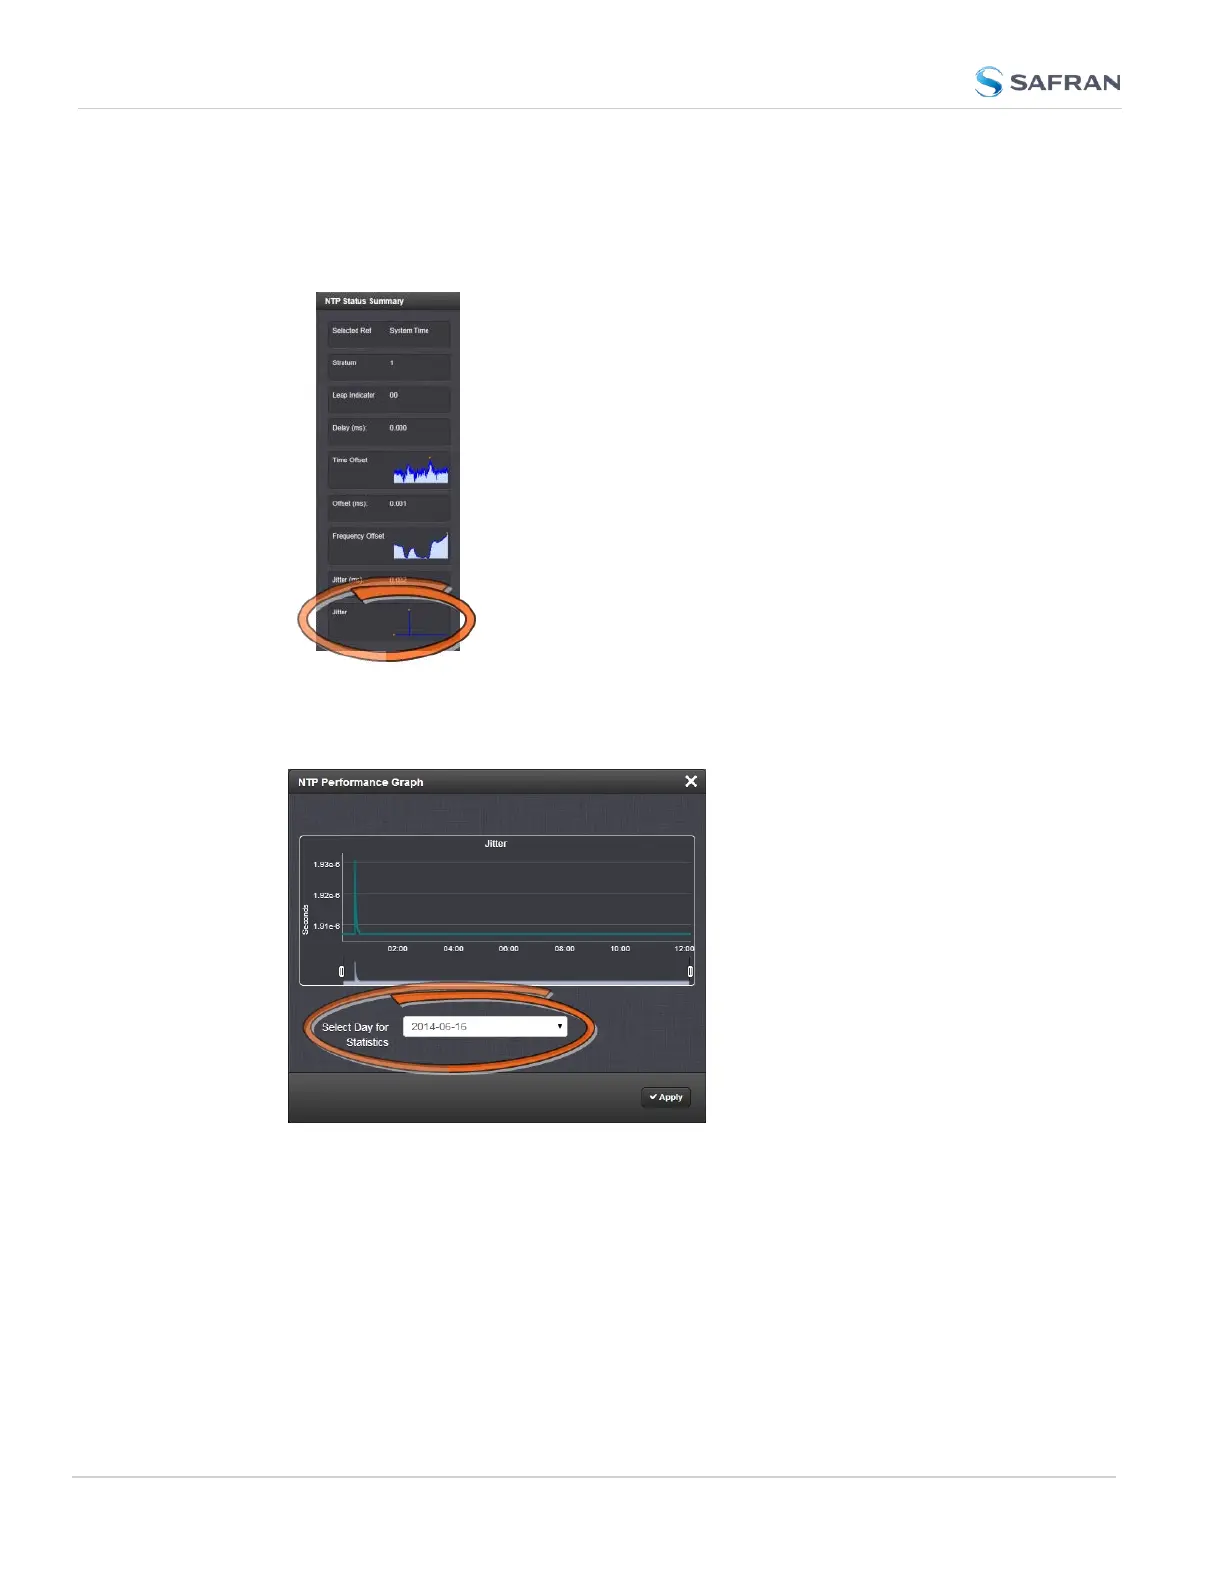
To view the NTP Jitter performance graph:
1.
Navigate to MANAGEMENT > NETWORK: NTP Setup screen.
2.
In the NTP Status Summary panel locate the Jitter graph.
3.
Click the graph in the NTP Status Summary panel.
4.
The NTP Performance Graph panel will appear.
5. To select the statistics for a particular day, select a date from the drop-
down list in the Select Day for Statistics field. The default date is the
present date. Click the Apply button.
322
CHAPTER 4 • SecureSync 2400 User Manual Rev. 5.2
4.5 Quality Management
 Loading...