- Velocity low: Velocity of the axis during
this segment.
- Acceleration: Species the acceleration
of the axis when increasing the velocity.
Parameterized jumps may occur in the
acceleration when 2 succeeding
segments have dierent End acceleration
and Start acceleration values.
- Deceleration: Species the deceleration
of the axis when decreasing the velocity.
- Do compensation: Species if friction
compensation should take place. If True
is selected, the measured friction is
compensated automatically by the servo
drive. If False is selected, the value can
be used for diagnostics.
- Guide value: Species the guide value
oset for starting the measurement.
- Timeout: Species the timeout in ms for
reaching the guide value oset and
starting the measurement.
The friction segment can only be edited using the Property
Window. The duration of the segment is used for
calculating the segment length. The highest value of
Velocity low and Velocity high is used for calculating the
segment polynomial. For fast visual identication, F
t
is
shown in the middle of the segment. Illustration 5.80 shows
a friction segment with the following settings:
•
Velocity high: 120 RPM
•
Velocity low: 60 RPM
•
Duration: 2075 ms
As the Velocity high value is higher than the Velocity low
value, it is used for calculating and visualizing the
segment.
Illustration 5.80 Friction Segment
Event segment path visualization
The event nodes do not have xed guide value positions.
They are calculated by the preceding segments. Whenever
an Event node has 2 succeeding event segments, either 1
of those may be activated when a CAM prole is activated.
This in turn aects the positions of all following event
nodes and segments. This behavior may result in complex
proles that are dicult to calculate and visualize. To help
create complex event-based behavior, the advanced CAM
Editor computes an active segment path by using the
default segments for all nodes.
The default segment path is iteratively computed as
follows:
•
The 1
st
event node of the parent Event segment
container is selected and its default segment is
marked as active.
•
In the marked segment, the default segment of
the succeeding event node is marked as active.
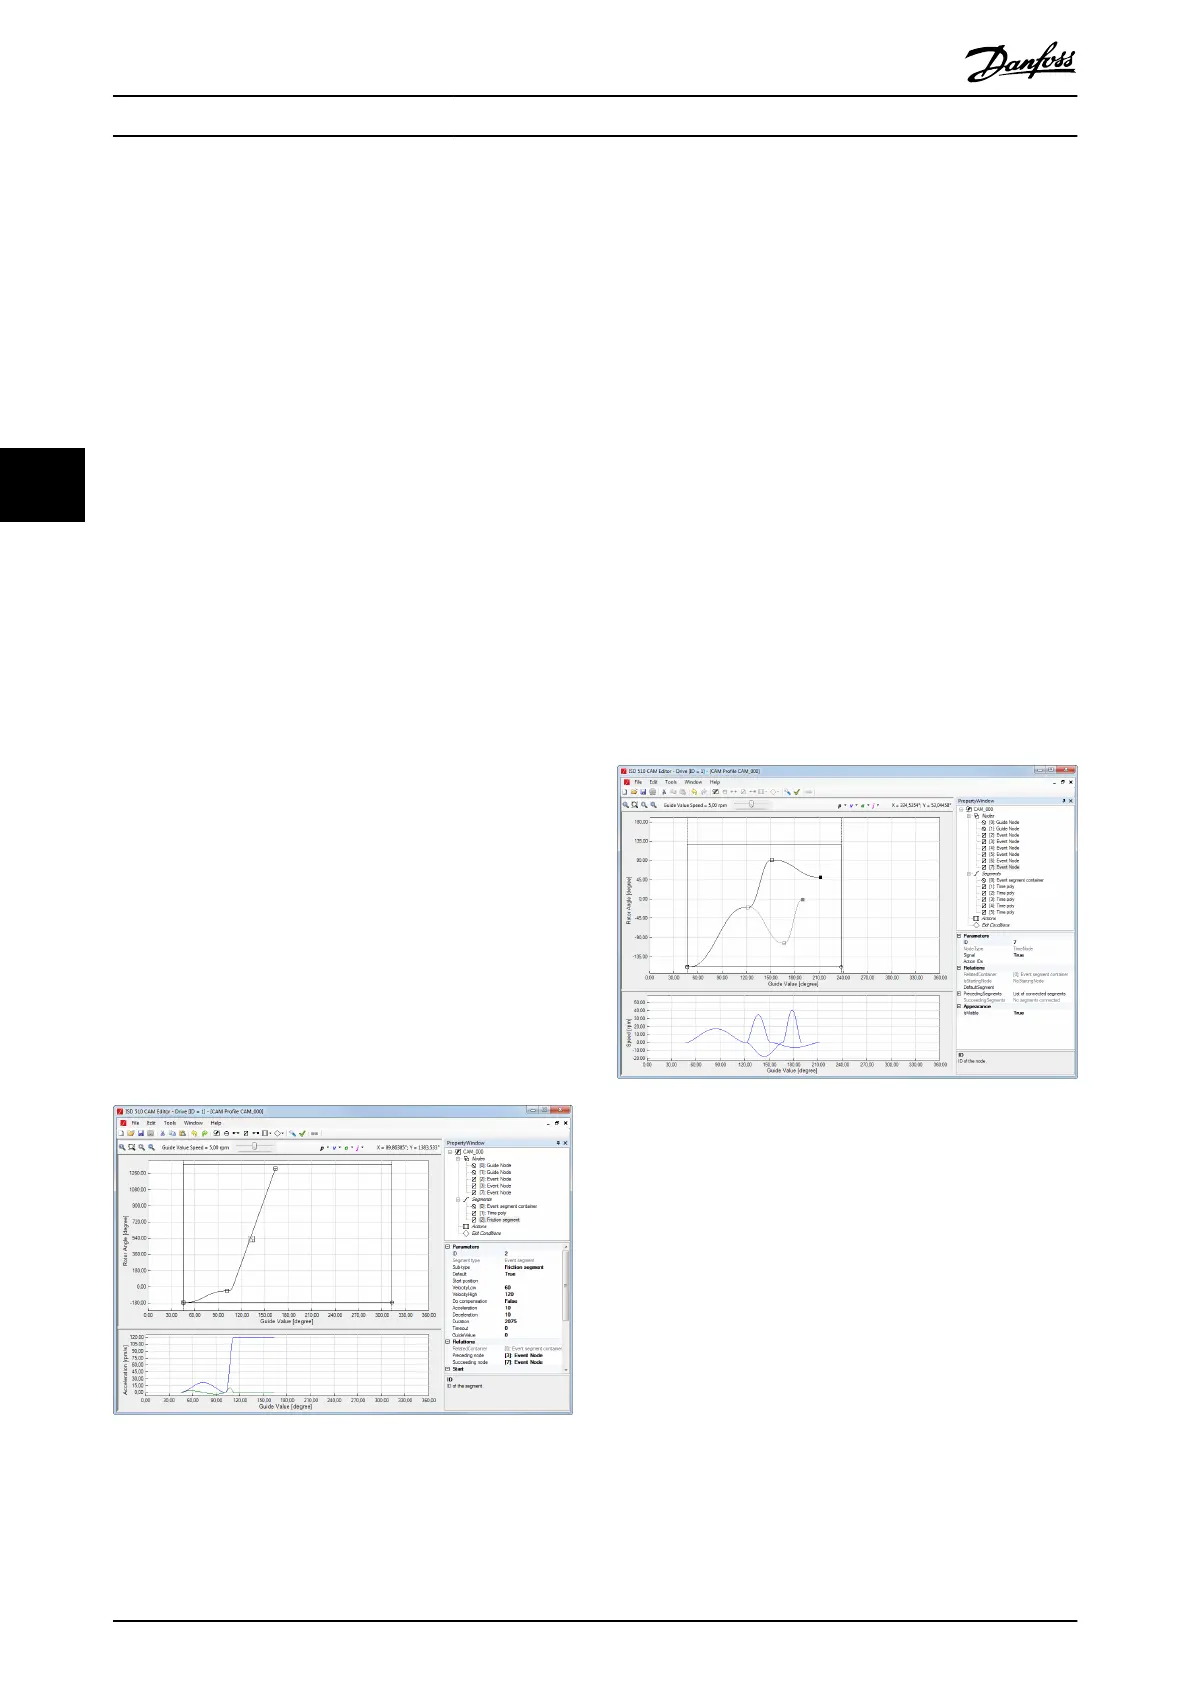
All iterated nodes and marked segments are shown in the
visualized path and are visualized as black curves.
Segments and nodes that are not marked as active are
visualized as gray curves (see Illustration 5.81).
Illustration 5.81 Visualization of 2 Paths within an Event
Segment Container
A change to a default segment of an event node results in
a modication of the entire active path shown. This
behavior is shown in Illustration 5.82 and Illustration 5.83
where the default segment of the 2
nd
node is switched.
This triggers a new computation of the following path and
a relocation of all succeeding elements due to the dierent
duration and end position of the newly selected default
segment.
Operation with ISD Toolbox
VLT
®
Integrated Servo Drive ISD
®
510 System
156 Danfoss A/S © 01/2017 All rights reserved. MG36D102
55
 Loading...