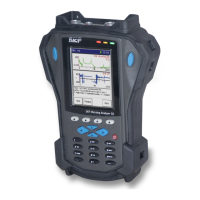
The Analyzer Module
How to Collect Standard Vibration Measurements
1x RPM – Press the 1x RPM function button to select the running speed line
and select the speed for the measurement.
Stop – (or Enter key) If you determine that measurement conditions are stable,
and to save time you do not wish to apply the measurement’s No. Averages
setting, or if the machine conditions are in a state for which you wish to
immediately capture the measurement, then press the Stop function button.
The measurement results immediately freeze on the display (no averaging is
performed), and the screen’s Average button changes to a Save button,
allowing you to save the measurement data. Again, the Stop button changes
to a Start button, allowing you to re-start the measurement, if desired.
• Press either the Average or Stop function button to record the measurement, as
described above.
View (shifted function button) - Use the View function button to determine how to view
the displayed measurement results. View options for Analyzer measurements include:
FFT for CH1 (default)
Power Cepstrum for CH1 – A Power Cepstrum is the result of taking the
inverse Fourier transform of the logarithm of the spectrum of a signal. A
Power Cepstrum converts the power spectrum values and converts them to
decibels, then performs a FFT on the shape to produce another spectrum.
With a Power Cepstrum, both negative and positive values display. A Power
Cepstrum contains information about rate of change in the different spectrum
bands. It has higher, more obvious peaks, which makes it easier for the analyst
to identify, giving a better insight into the repetition of both signals.
Power Spectrum for CH1 - The squared values (amplitude) of a spectrum
(squaring of every spectrum amplitude). When creating a power spectrum, the
units modify to the original units and are squared (
2
).
FFT+Power Cepstrum for CH1
FFT+Power Spectrum for CH1
Table of peaks for CH1 – Displays measurement results in tabular form for
the spectrum’s eight highest amplitude peaks. For each peak, displays the
peak’s frequency , amplitude, and phase angle (if applicable).
SKF Microlog - GX Series 4 - 5
User Manual

 Loading...