Run Up / Coast Down Module
Displaying Acquired Data
• After setting Spectgm Disp. Setup options, press the Display function button to
display the Spectrogram plot.
Figure 7 - 27.
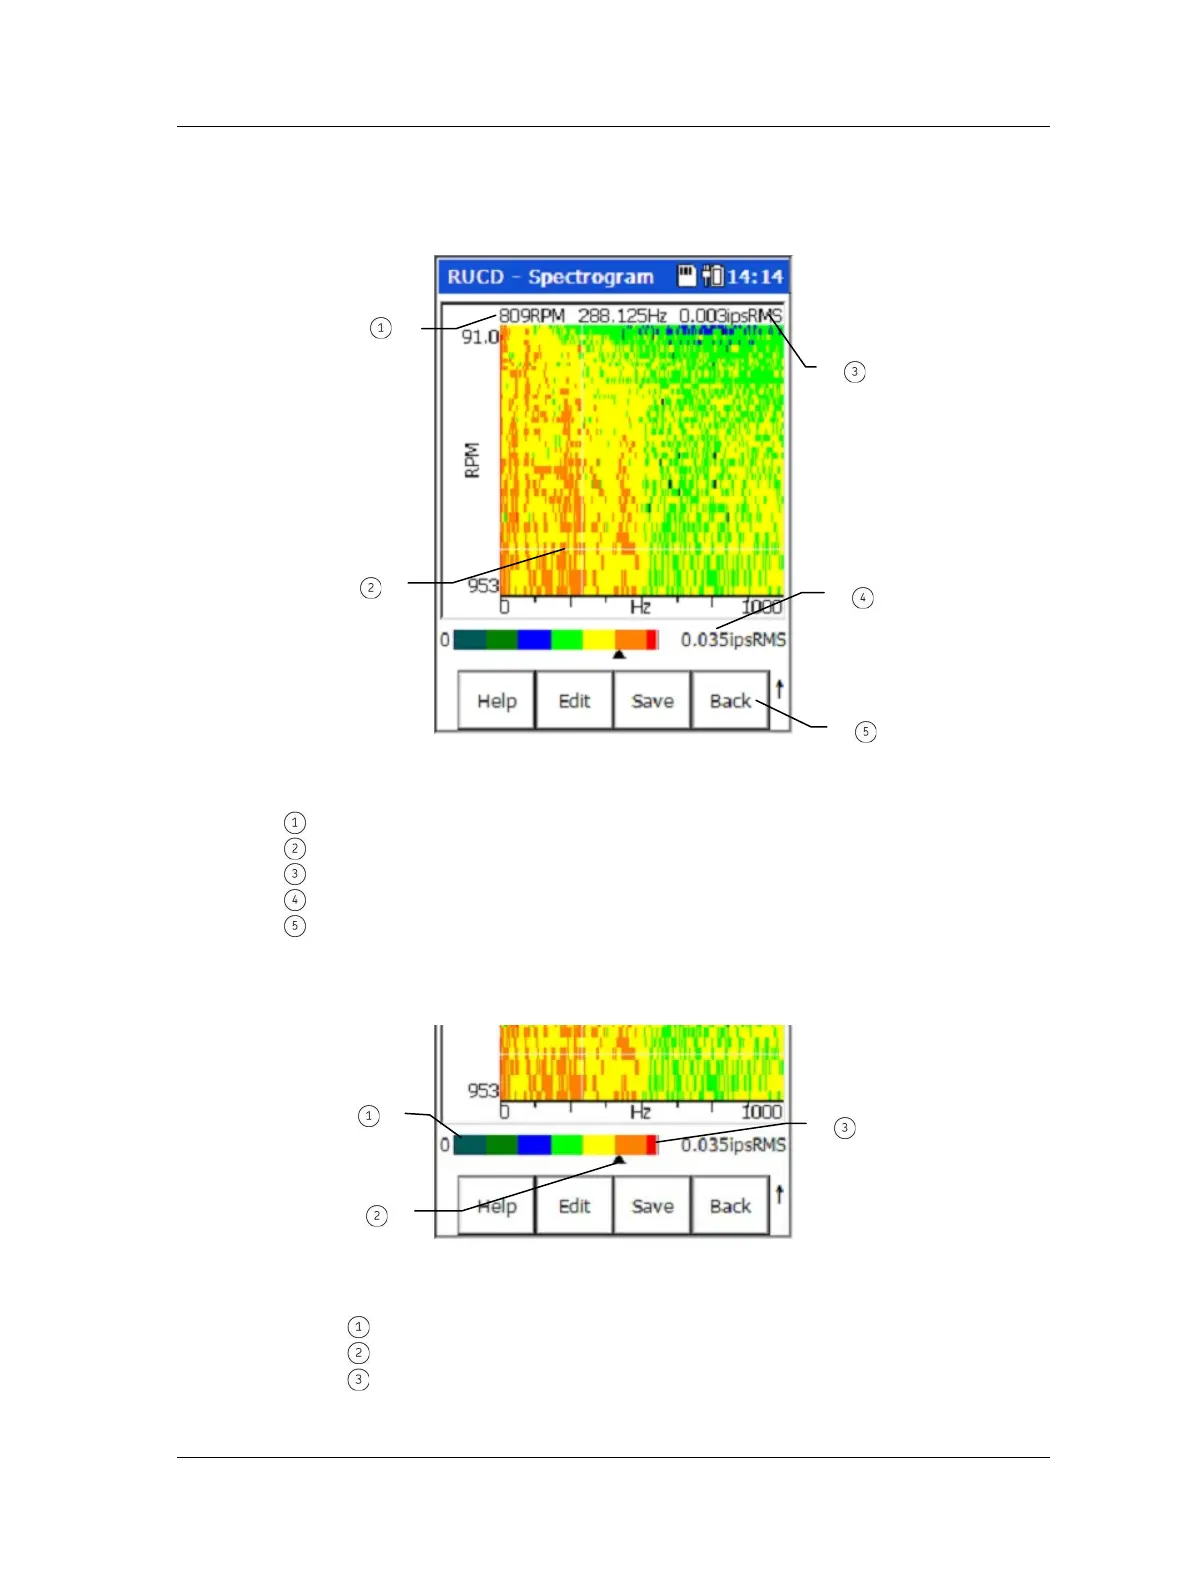
Example Spectrogram Plot.
speed at which active spectrum was captured
cursor
frequency and magnitude at cursor position on active spectrum
spectrogram display status area
allows instant display of a waterfall plot using the same settings
Spectrogram “Display Status” Area
Figure 7 - 28.
Spectrogram “Display Status” Indicators.
lowest amplitude and associated color indication
color (amplitude indicator) at cursor position on active trace
highest amplitude and associated color indication
SKF Microlog - GX Series 7 - 25
User Manual

 Loading...


