Idler Sound Monitor Module
How to Perform a Conveyor Idler Roller Survey
How to Analyze Faulty Idler Rollers
In the event of a Suspect or Bad indication, you may wish to view which of the four
acoustic measurements resulted in alarm to help determine the type of conveyor idler
fault.
To view individual measurement results and alarm status:
• Continue to aim the parabolic reflector at the faulty idler rollers, and from the
traffic light indicator screen, press the Analysis function button (or press either
Enter button to toggle to and from the Analysis display). An Analysis screen
displays the four individual measurement results and their alarm status in live bar
graph format.
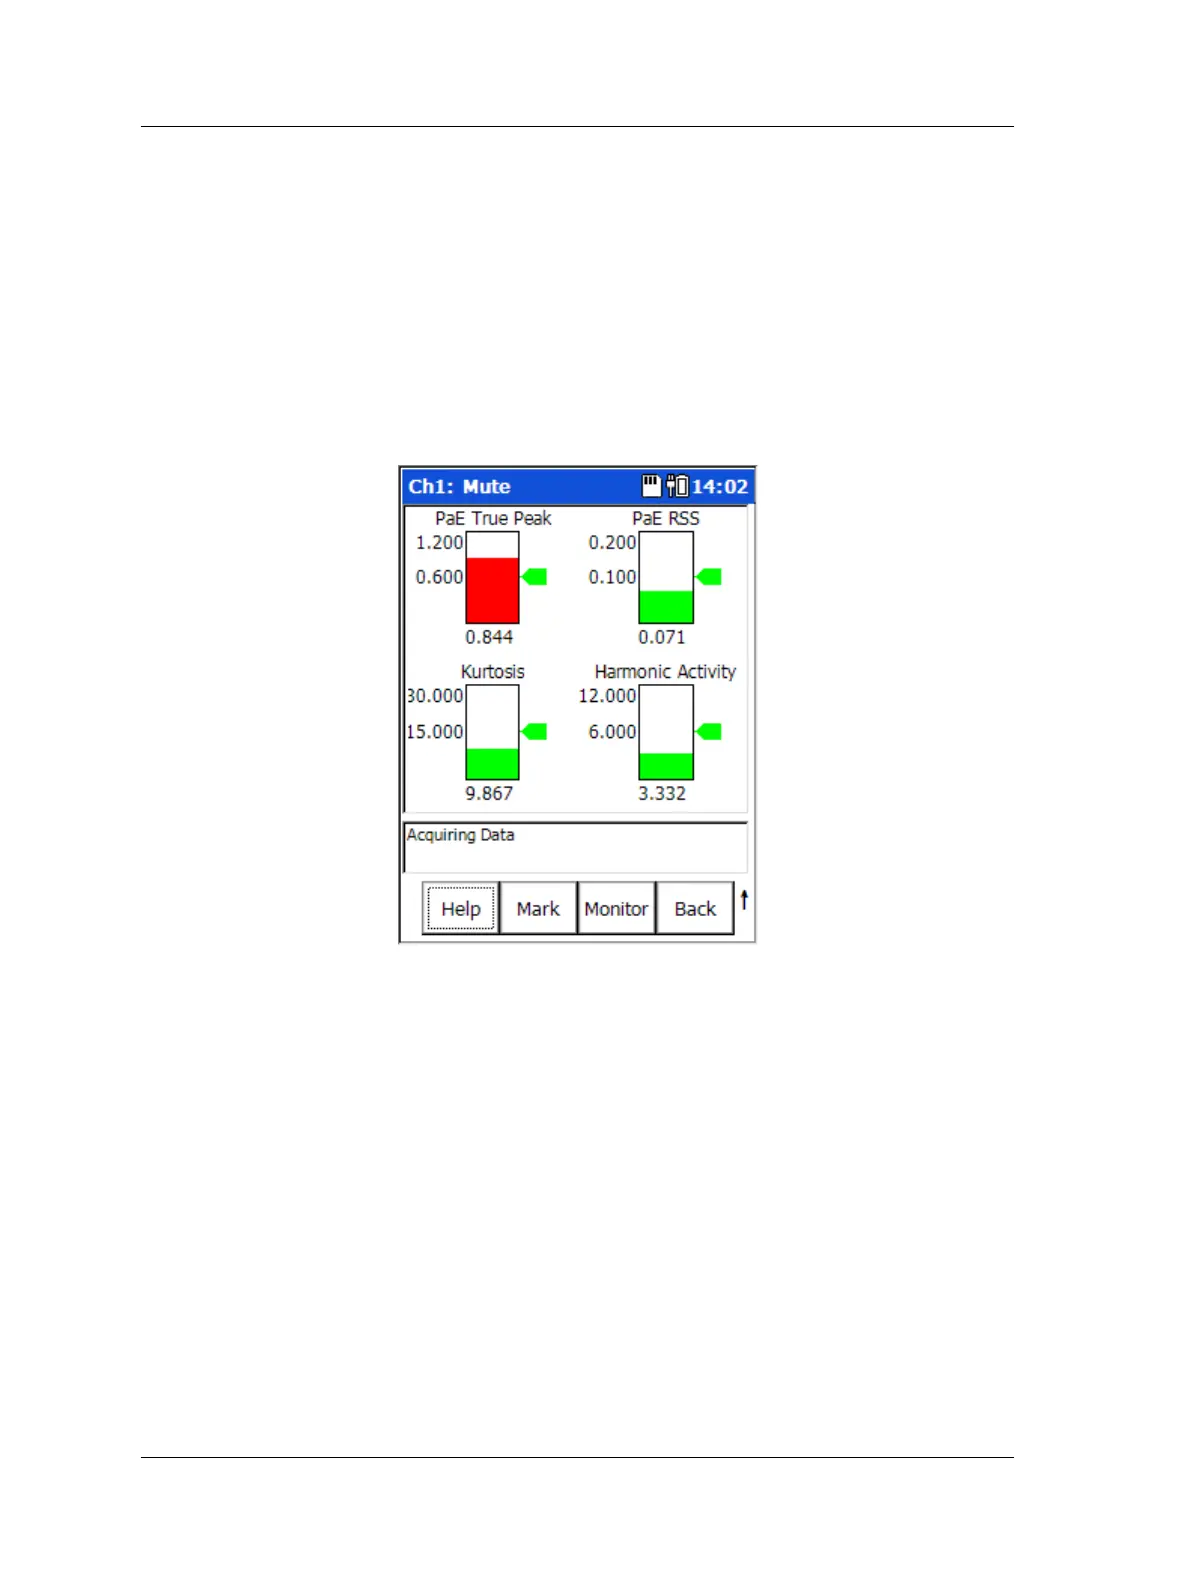
Figure 11 - 17.
An Example Analysis Display.
In the Analysis display, live bar graphs display for each of the four acoustic
measurements. Each measurement’s current value is displayed beneath its bar graph.
The scale of the bar graphs is from 0 to 200% of each measurement’s alarm value, with
a green arrow representing 100% of the alarm limit. Each measurement’s bar graph is
green if its current value is below its alarm limit, or red if above its alarm limit. The
value of each alarm limit displays at the bar graph’s mid point.
• Press the Monitor function button (or an Enter button) to return to the traffic light
indicator display.
11 - 18 SKF Microlog - GX Series
User Manual

 Loading...


