The ROUTE Module
Viewing Time Waveform Data
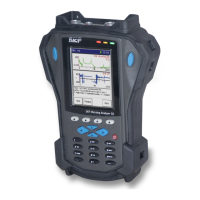
Figure 3 - 9.
A Time Waveform Display Screen.
Items on the time waveform display screen include:
Overall value – The measurement’s overall value displays in the display’s upper left
corner.
Cursor position/amplitude – Use the left/right arrow buttons to move the time
waveform’s cursor. The cursor position and amplitude display in the upper right corner.
Percent Changed Bar - The bar to the right of the time waveform provides information
about the overall value of the measurement in comparison to alert and danger alarms
(yellow and red arrows, respectively) and to the previous measurement (green arrow).
The current measurement value is represented by the colored bar, which displays red if
the POINT is in alarm, yellow if it is in alert, and green if there is no alarm. If the
measurement amplitude extends beyond the display, an “overall overflow” indicator
appears at the top of the bar as a small, gray arrow. The bar also displays the
percentage of change from the previous overall reading. A positive percentage indicates
the measurement is greater than the previous reading. A negative percentage indicates
the measurement is less than the previous reading.
Function Buttons
Time waveform display function buttons operate similarly to those previously described
for spectral display screens.
3 - 16 SKF Microlog - GX Series
User Manual

 Loading...