The ROUTE Module
How to Review Collected Data
To view historical data as a waterfall plot:
• Select the View function button.
• From the View Options screen, use the up/down arrow buttons to highlight the
View option and press the right arrow button. A drop-down list appears.
• Use the up/down arrow buttons to select Waterfall: Default View and press an
Enter button.
• Press the Apply function button to return to the Review Data screen in waterfall
mode.
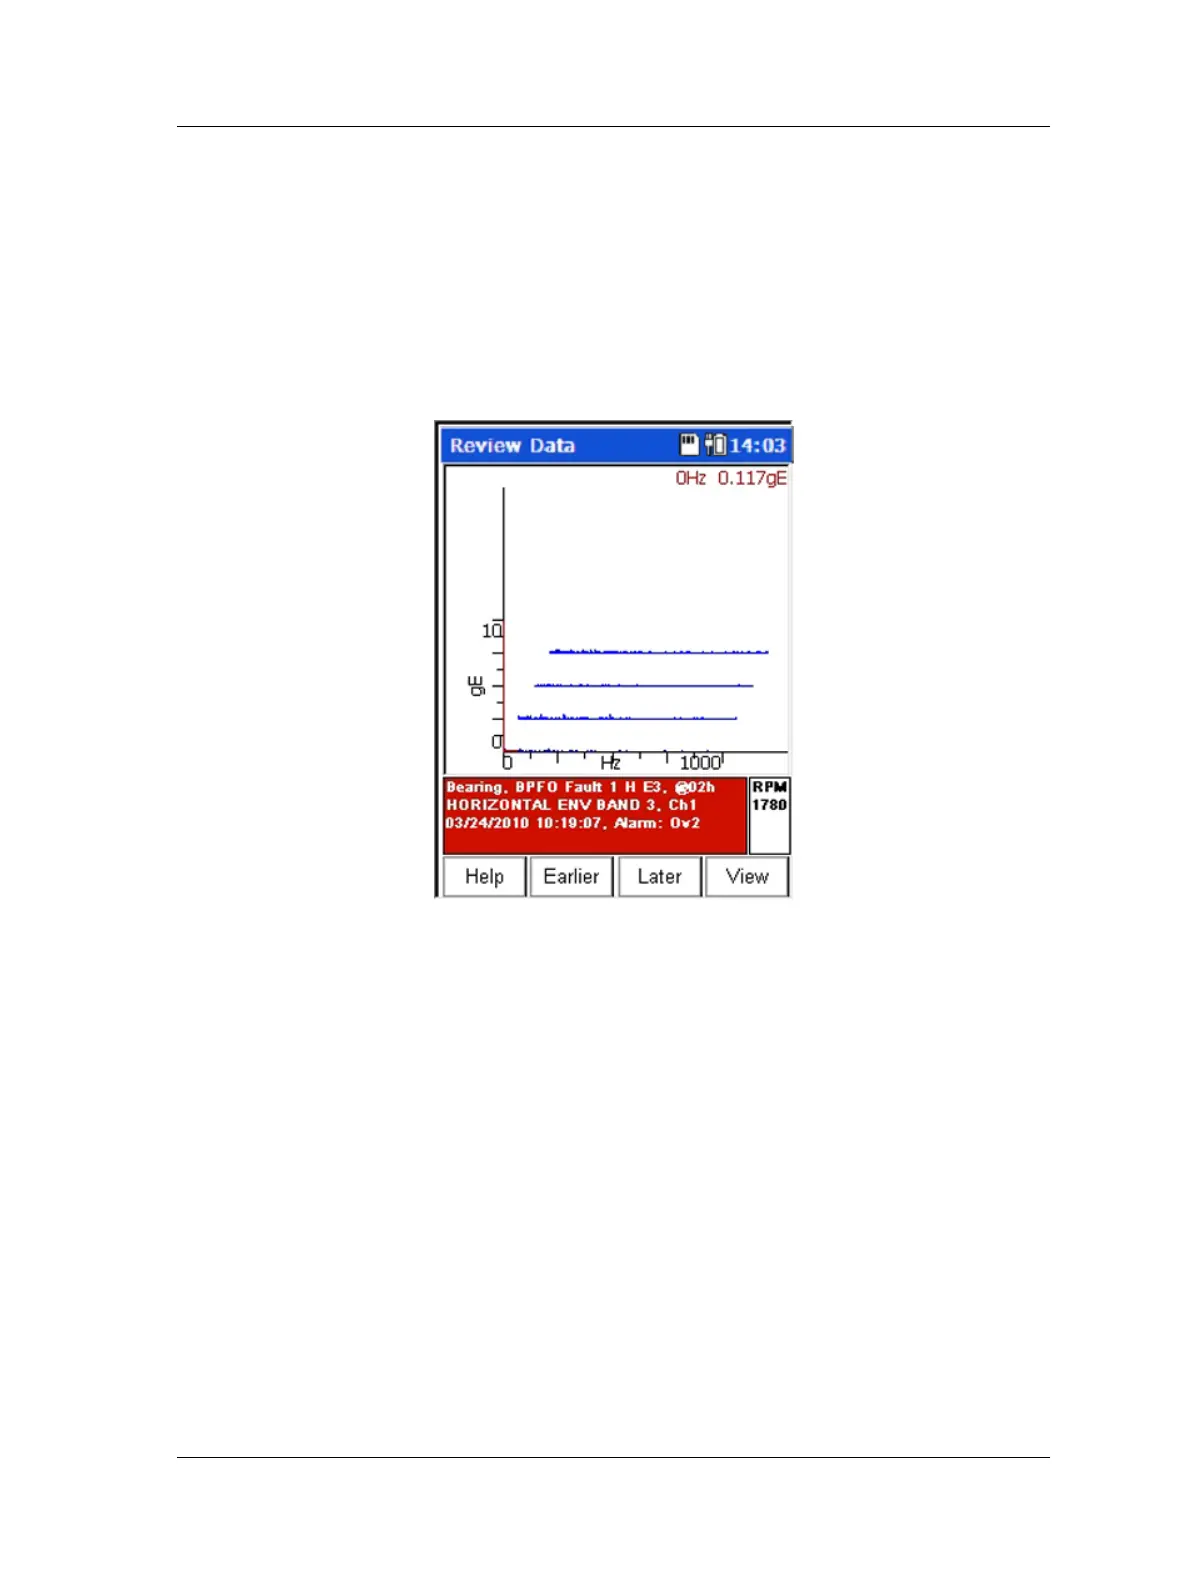
Figure 3 - 19.
Historical Data – Waterfall View.
The traces display in chronological order with the most recent measurement in the
front. You may use the Earlier and Later function buttons to scroll through the
measurements. The selected measurement’s spectrum is bolded and information for
the measurement displays in the information area at the bottom of the screen.
SKF Microlog - GX Series 3 - 33
User Manual

 Loading...


