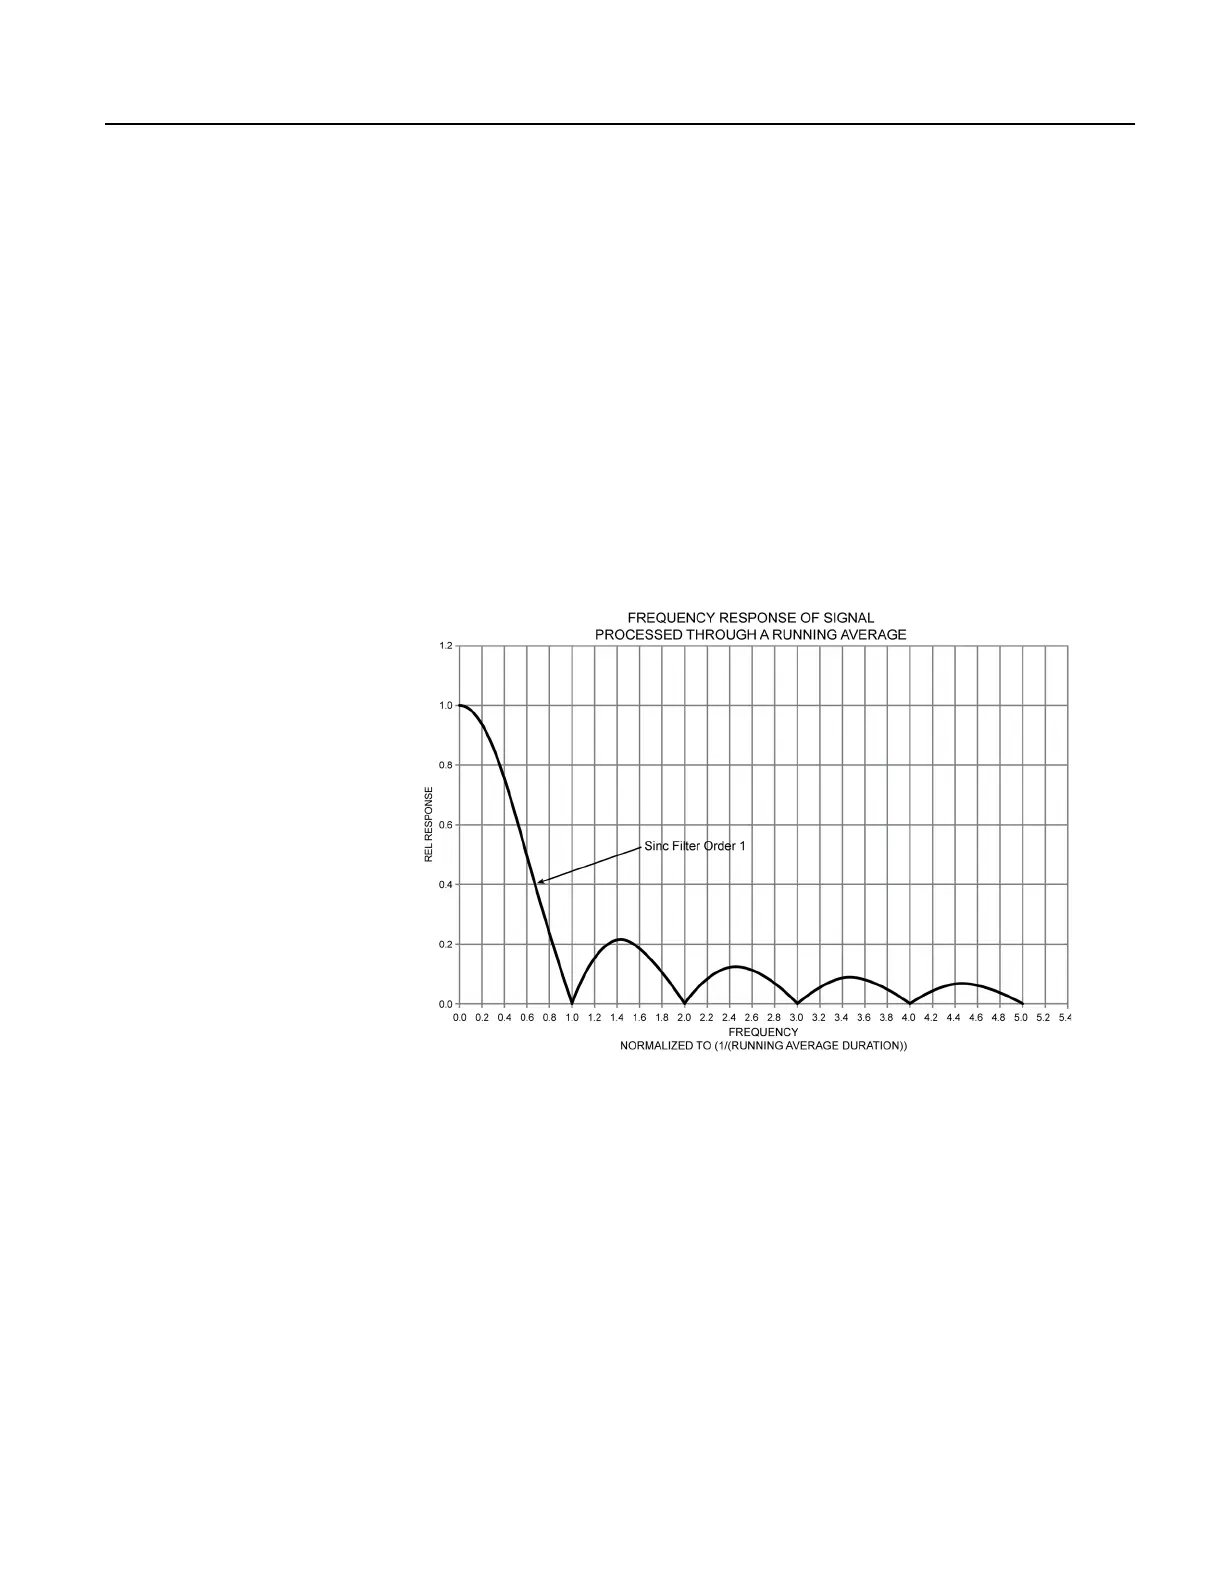
36 Hz / 50 Hz = 0.72
SIN(0.72π) / (0.72π) = 0.34.
So, the recorded amplitude was about 1/3 of the input-signal amplitude. A
CRBasic program was written with variables Accel2 and Accel2RA. The
raw measurement was stored in Accel2. Accel2RA held the result of
performing a running average on the Accel2. Both values were stored at a
rate of 500 Hz. Figure Running-Average Signal Attenuation
(p. 195) shows the
two variables plotted to illustrate the attenuation. The running-average value
has the lower amplitude.
The resultant delay, D
r
, is calculated as follows:
D
r
= (scan rate) • (N–1)/2 = 2 ms (10–1)/2
= 9 ms
D
r
is about 1/3 of the input-signal period.
Figure 52. Running-Average Frequency Response
194
 Loading...