5.7.3.6 Polling
When a trace is started with a triggering condition, the
condition may not be met for a long time (for example,
trigger on error). In this case, polling for data ready is not
desired until the trace is done. Therefore, stop polling and
manually check for data ready after a certain period of
time.
Polling can be enabled or disabled on the Scope by using
the tool strip button Polling for data ready. When polling is
active, the button shows a green play icon; when polling is
deactivated, the button shows a blue square stop icon (see
Illustration 5.32). Polling is enabled by default.
Illustration 5.32 Polling for Data Ready Button States
5.7.3.7 Canceling a Trace
It is possible to stop a running trace by clicking on the
Stop button if the Scope is in 1 of the states Waiting,
Acquiring, or Triggered.
5.7.3.8 Trace Visualization
Trace data is visualized on a 2-dimensional chart. The
horizontal axis represents time and the vertical axis
represents signal values.
In order to easily compare and analyze the values of
multiple signals at a given point in time, the data visuali-
zation for all traced signals is on the same chart, in which
the signals share the same (horizontal) time axis. Each
signal has its own vertical value scale and oset. It is
possible to do a direct comparison between the values of
2 signals with the same unit by setting the same vertical
scale and oset to both signals.
As the vertical axes of all signals are independent from
each other, they can only be congured separately using
the respective signal choosers. However, all traced signals
share the same horizontal axis and it can therefore only be
congured for all signals. The horizontal axis can be
congured either numerically by using the Scaling control
(see Illustration 5.33), or graphically by using the mouse to
select the view range (see Illustration 5.34).
The main tools for evaluating sample values on a
visualized trace are the 2 vertical cursors, shown as black
dashed lines on the chart control (see Illustration 5.28). The
positions of the vertical cursors can be set either
numerically by using the Measuring control (see
Illustration 5.33), or graphically by using the mouse to drag
a cursor to the desired position. When changing the
position of a cursor, the values of the elds Value at left
cursor and Value at right cursor are updated for every signal
to reect the cursor positions. By clicking on the button
next to the cursor position eld, the corresponding cursor
is set to the middle of the viewable screen. When selecting
the Value dierence display, the Scope automatically
calculates the numerical dierence between the values at
the cursor positions.
There are 2 auxiliary horizontal cursors that can ease the
comparison between signals; when moving a horizontal
cursor, a tooltip appears next to it, showing the vertical
position of the cursor for each signal (each signal has its
own vertical scale and oset).
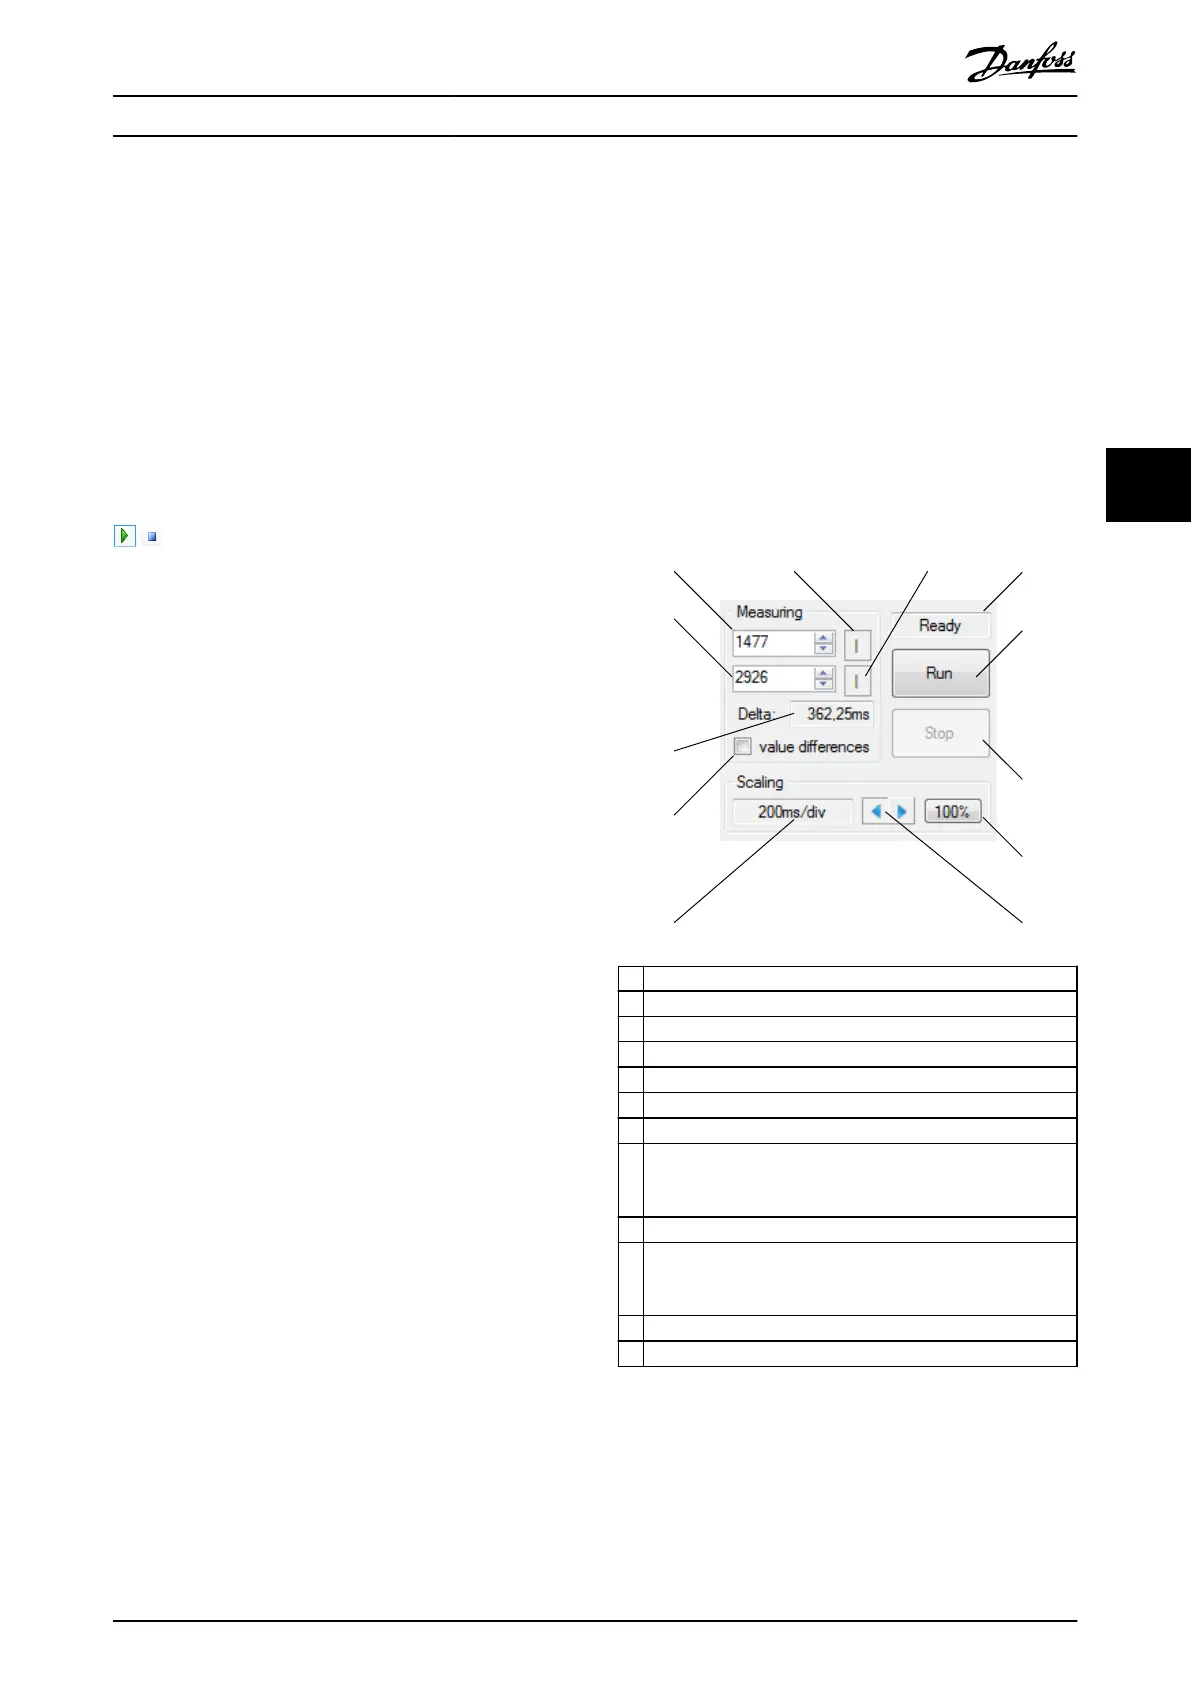
Illustration 5.33 depicts the Measuring and Scaling controls
that are shown on the left side of the Scope sub-tool.
When hovering over the Horizontal scale eld, a tooltip
appears that contains the frequency value corresponding
to the ms/div value.
2 3
4
5
6
7
89
10
11
12
1
130BE819.10
1 Sample index at left cursor.
2 Place left cursor in middle of view.
3 Place right cursor in middle of view.
4 Trace state.
5 Start a trace.
6 Cancel a running trace.
7 Increases/decreases the horizontal scale.
8 Horizontal scale adjustment.
Adjusts the horizontal scaling so that all samples are shown
within the view.
9 Horizontal scaling used in ms per division.
10 Enables/disables the display of the value dierences between
the cursors. The dierence is shown in the Signal Chooser
control.
11 Time delta between left and right cursor.
12 Sample index at right cursor.
Illustration 5.33 Trace Measuring and Horizontal Scaling
Operation with ISD Toolbox Programming Guide
MG36D102 Danfoss A/S © 01/2017 All rights reserved. 129
5 5
 Loading...