Trace
9836 3123 01 271 (428)
18 Trace
ToolsTalk PF provides a Trace function designed to present extensive information about the
tightenings.
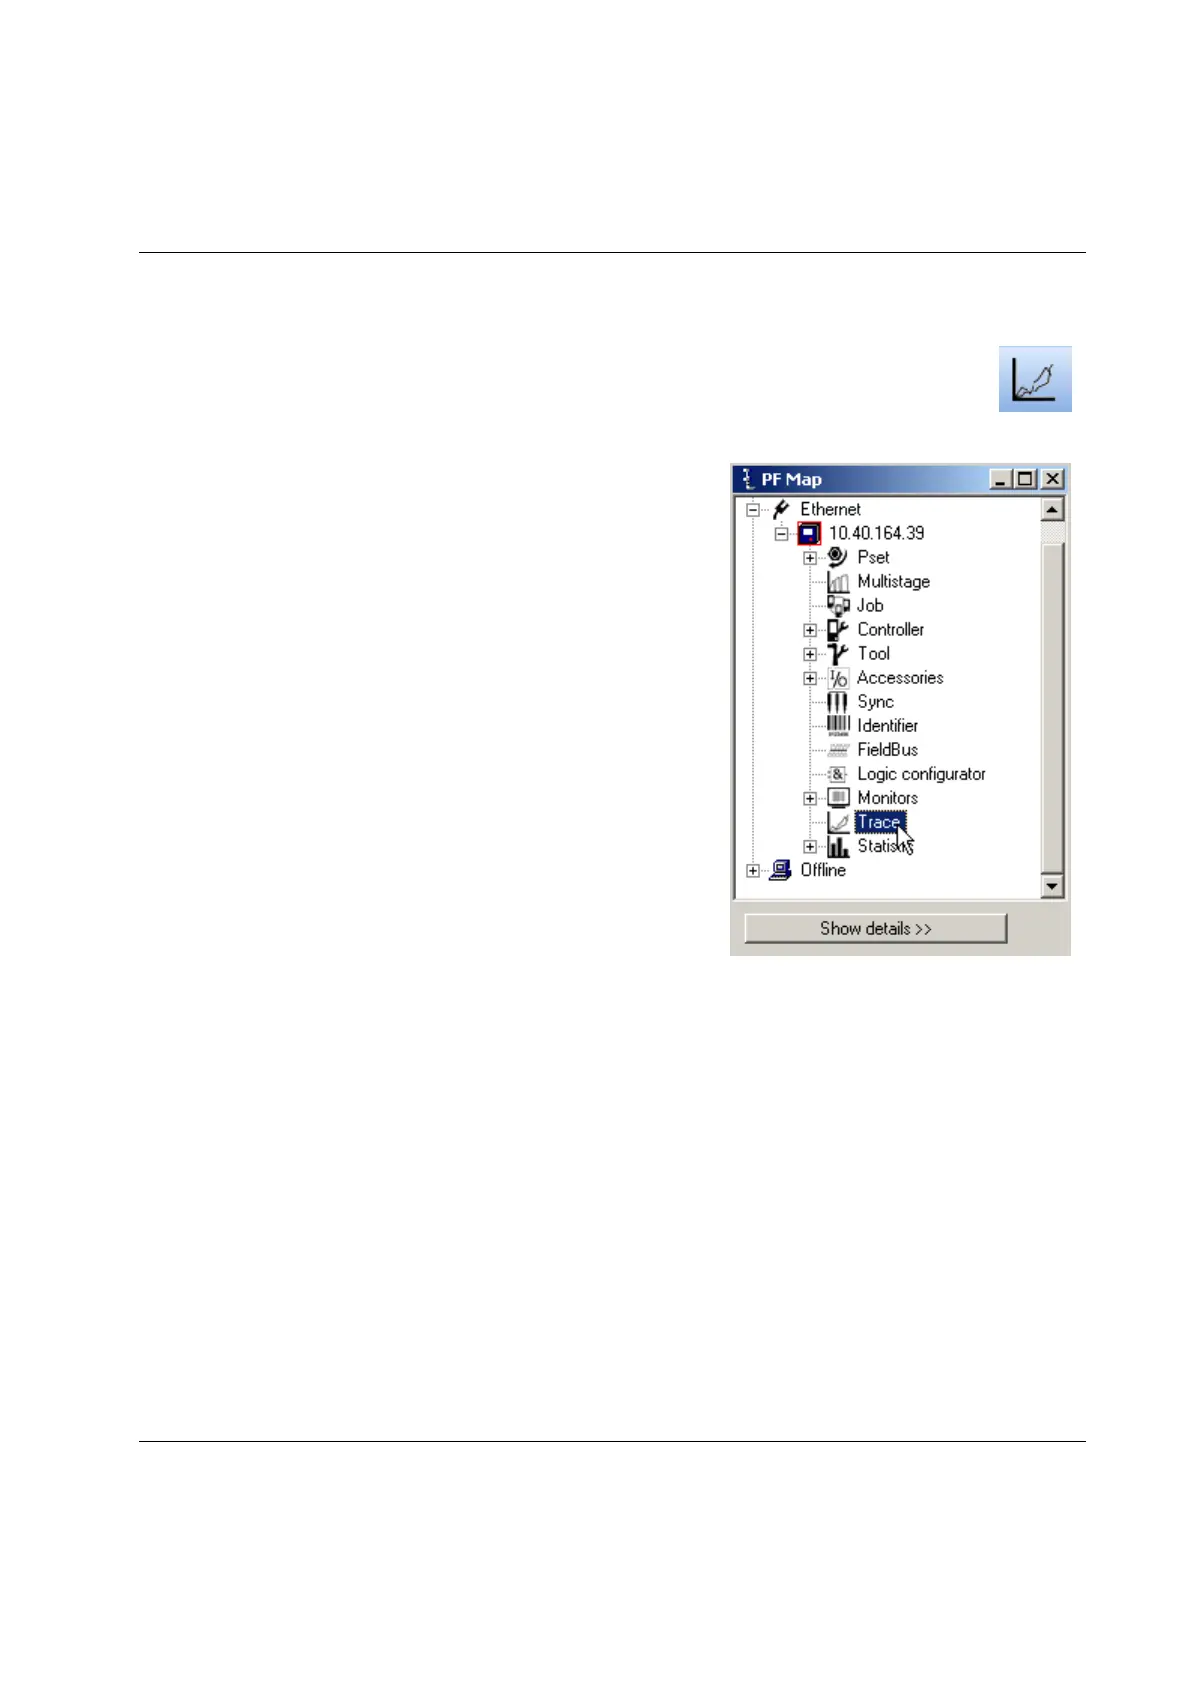
There are three different ways to open the Trace monitor:
In the PF Map, and double-click Trace.
In the main Menu list, select Window > Activate > Trace.
Click the Trace icon on the Toolbar.
18.1 The trace window
Select which type of chart to view; Torque over time, Angle over time, Speed over time, Torque and angle
over time, Torque over angle, Torque and Speed over time.
Press Scale limits to configure the axis according to preference.
With Angle offset selected, Trace shows graph from the P120 Start final angle torque value i.e. the Angle
axis is set to zero according to the P120 value. Traces that are below this value are shown in grey color. If
deselected, Trace shows graph from P110 Cycle start torque value.
With Envelop selected, the sample spread between traces is shown. Envelop is made of two traces; one
made of the maximum sample values and one with the minimum sample values taken from all displayed
traces.
 Loading...