5.7.3.3 Trace Signals
The Scope sub-tool reects the tracing functionality of the
devices and supports tracing up to 8 signals at the same
time. The channels are shown at the bottom of the Scope
window and can be congured, enabled, or disabled. Each
channel is represented by a signal chooser numbered 1–8.
Illustration 5.28 shows a trace with 3 enabled channels (1–
3) and 5 disabled channels (4–8).
For online devices, the list of available signals and their
denitions is automatically obtained by the ISD Toolbox
from the respective device. For oine devices, the list
included in the ISD Toolbox conguration is used.
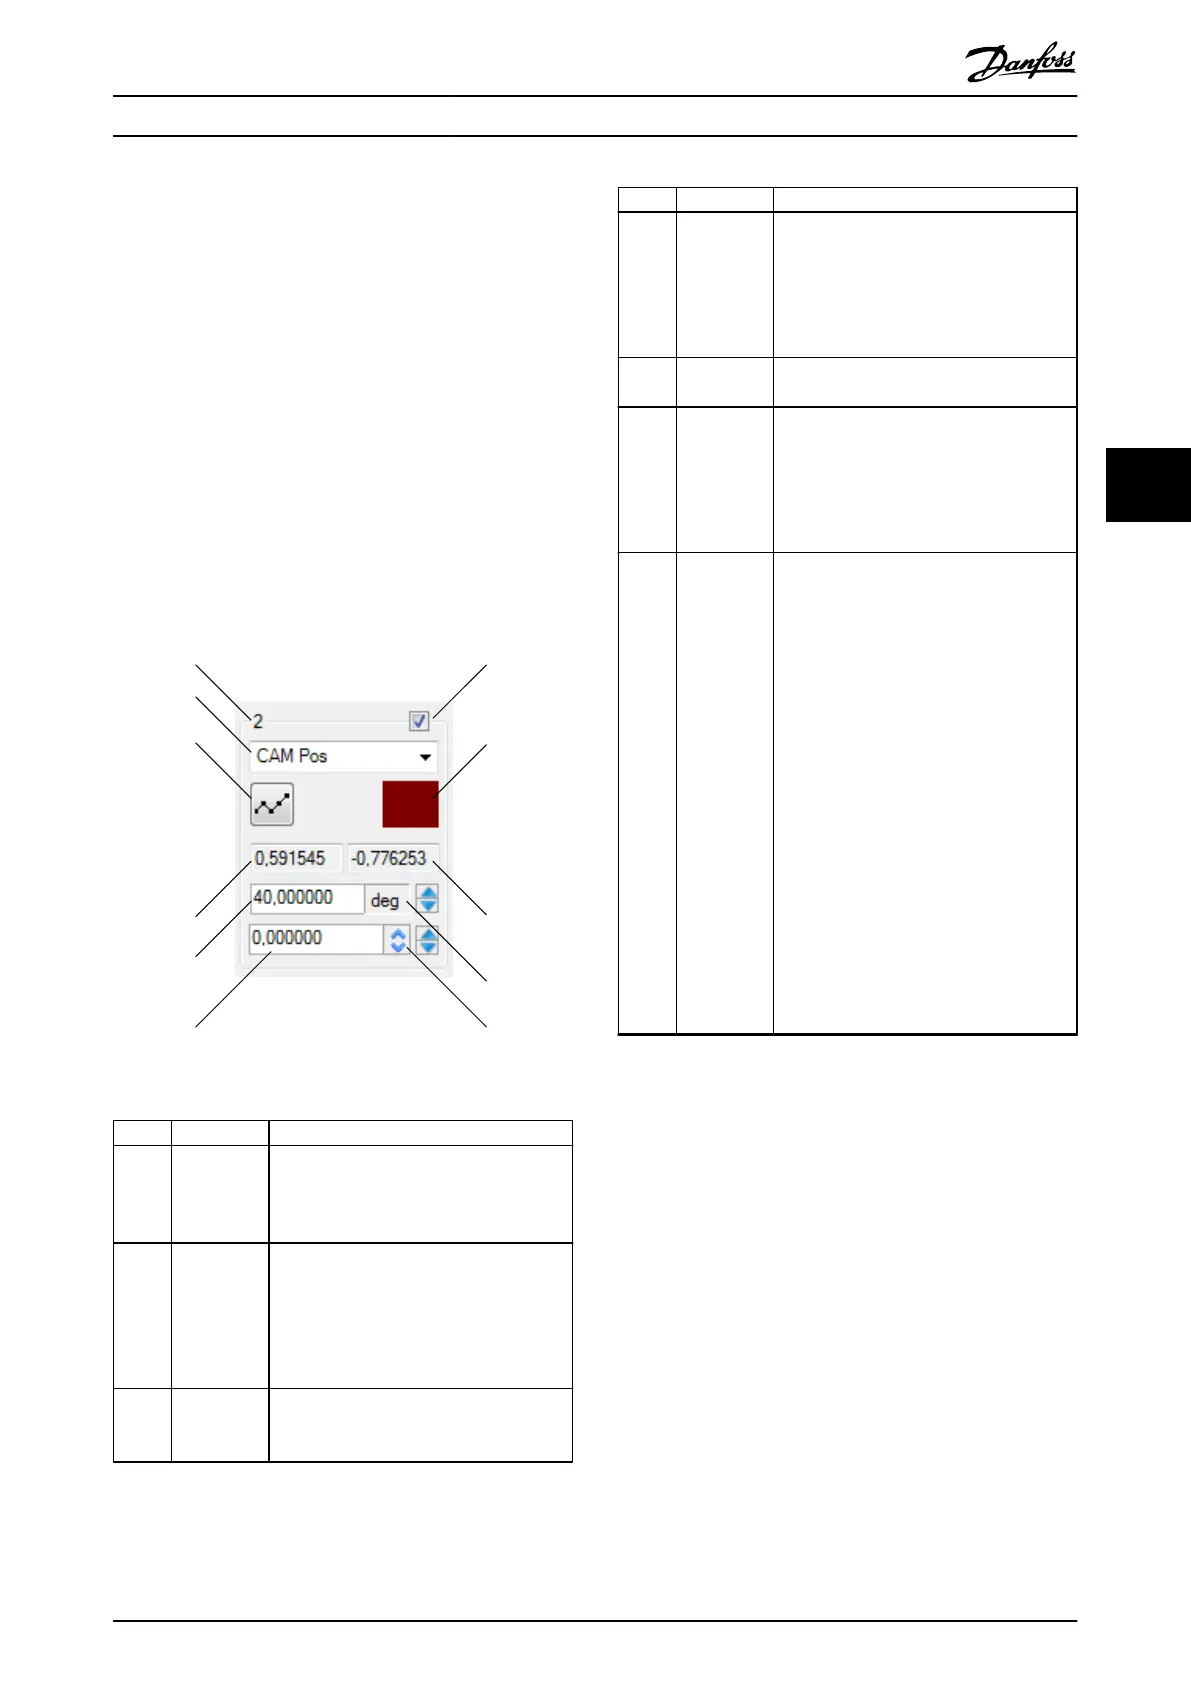
The Scope sub-tool presents the trace signals by their
names (see chapter 9.2.3 Trace Signals and
chapter 9.3.3 Trace Signals). Each Signal Chooser shows the
signal data and congures the graphical display, see
Illustration 5.31.
130BE818.10
1 2
3
4
5
67
8
9
10
11
Illustration 5.31 Signal Chooser
Callout Description Function
1 Channel
index
Shows the index of the channel that is
controlled by the Signal Chooser. The
signal channels are numbered 1–8 (see
Illustration 5.28).
2 Channel
activation
checkbox
The checkbox controls whether the given
channel is recorded on the device. By
selecting and deselecting the channel
activation checkboxes, the number of
signals to be traced in the next trace is
congured.
3 Channel
color
Sets the color in which the traced data for
the given channel is visualized. The color
of a channel can be changed at any time.
Callout Description Function
4 Value at
right cursor
The left and right cursor elds show the
values of the trace data at the 2 cursors in
the unit shown by signal unit. The 2 elds
are updated dynamically while dragging.
The value elds show the traced values
with the precision of 6 decimal places.
5 Signal unit The unit in which the traced data for the
signal is shown.
6 Auto scale Calculates the best scale and oset for
showing the entire graph on the plot and
performs them.
Modies the vertical scale and the vertical
oset of this signal (see
chapter 5.7.3.8 Trace Visualization).
7 Vertical
oset
Both an input and a visualization control
for the vertical oset of the signal. A
vertical oset of 0 means that the vertical
zero-point of the graph is located exactly
in the vertical center of the plot area. The
oset value is shown in the same way as
the vertical scale and the values at the
left and right cursors: with 6 decimal
places and in the unit shown by Signal
unit.
The vertical oset can be modied in 3
ways:
•
Type in the desired oset in the
Vertical oset eld.
•
Use the up/down arrows on the right
of the Vertical oset.
•
Auto-scale the trace using the Auto
scale button (modies the vertical
scaling and the oset of this channel).
Operation with ISD Toolbox Programming Guide
MG36D102 Danfoss A/S © 01/2017 All rights reserved. 127
5 5
 Loading...