4200-900-01 Rev. K / February 2017 Return to Section Topics 3-45
Model 4200-SCS User’s Manual Section 3: Common Device Characterization Tests
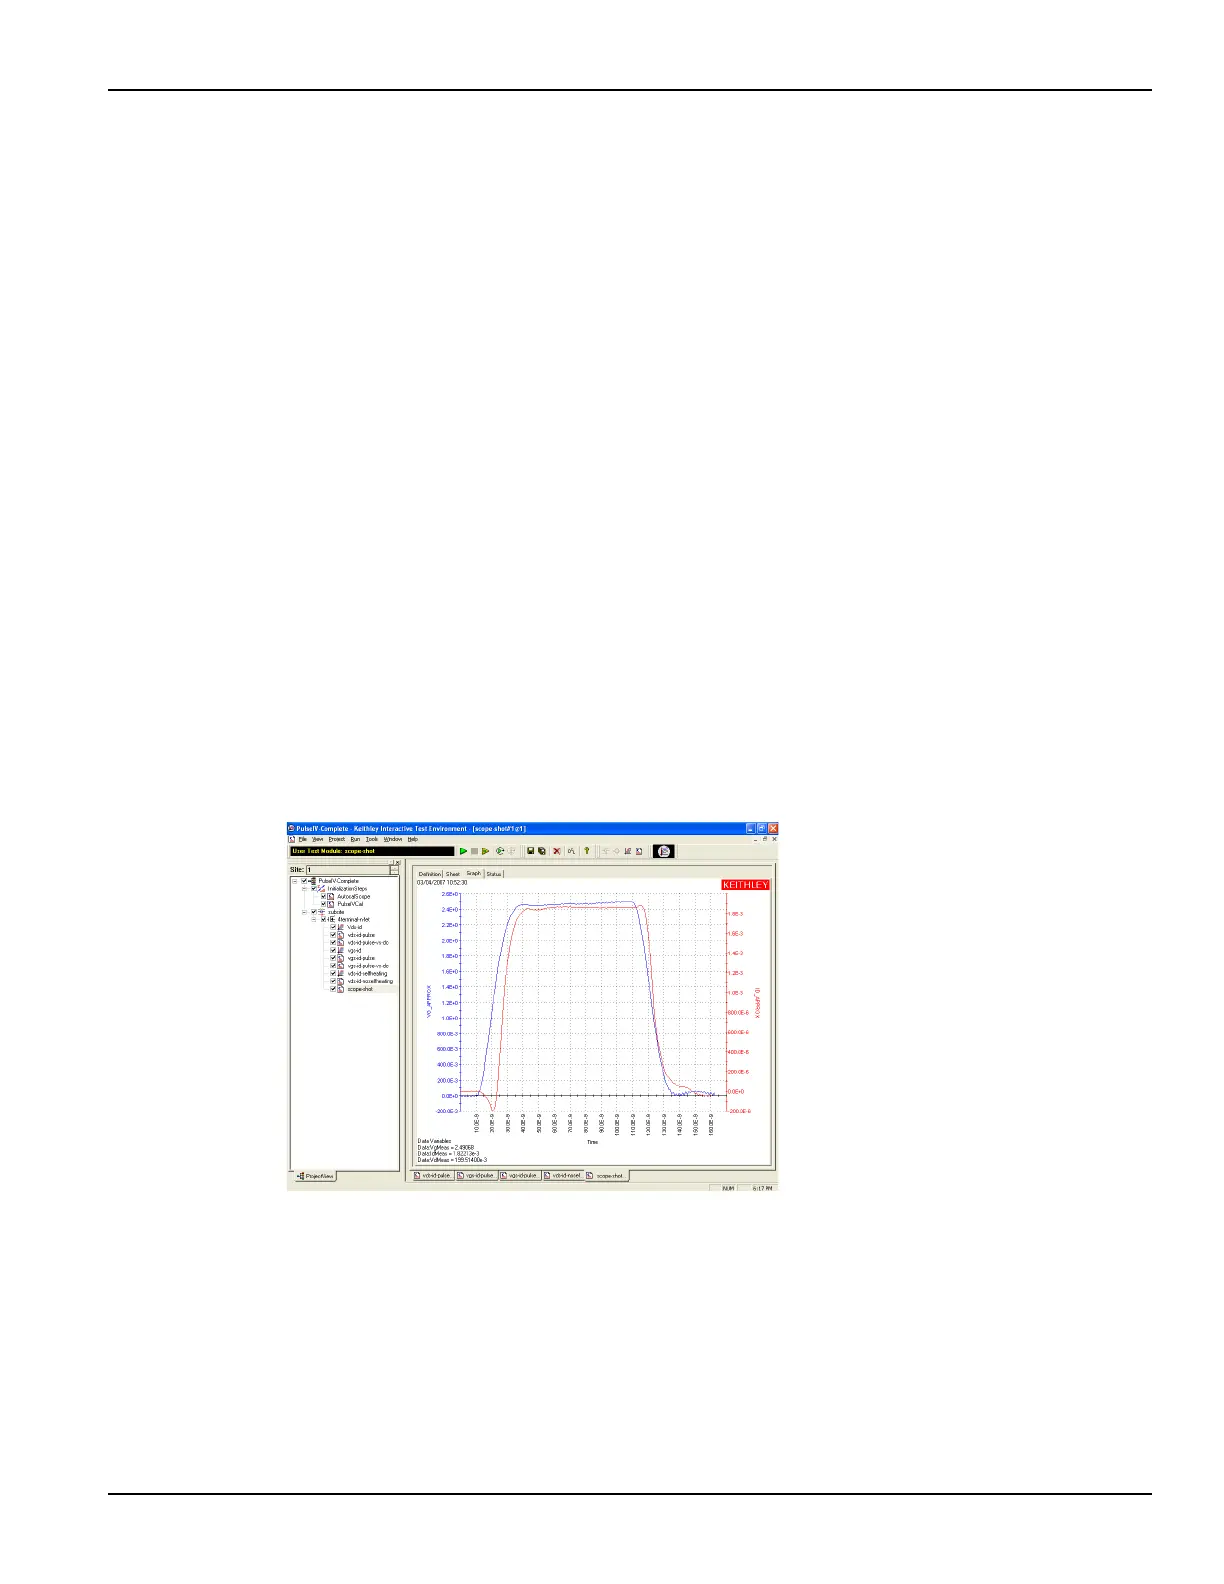
Running scope-shot
The scope-shot test is used to verify proper connection and system setup. The
waveform shown in Figure 3-45 is a typical result; actual results should be similar.
If waveform has significant ringing or overshoot, the pulse IV tests will not provide
good results. Check the pulse interconnects to ensure proper cabling and ensure
all connections are tight. If using the 4200- PRB-C cables (Y adapter cable for
pulsing with DC interconnect and structures), ensure that the two ground lugs are
connected together.
The left pulse curve (blue) is the pulse applied to the gate. The displayed
waveform data has approximate calibration factors applied, but the calibrated
measurement is given in the lower left portion of the Graph tab. Note that the Data
Variables values in the lower left corner just display the Data values, not
subsequent test runs (Appends) which are only graphically displayed. The right
pulse curve (red) is the drain current, shown with approximate calibration factors
applied, with the calibrated Vd and Id measurements listed in the lower left corner
of the graph.
The AverageNum value specifies the number of pulses that are averaged
together to provide the data. The DUT will have more pulses applied than
AverageNum due to other test factors, such as load line correction and
measurement autoranging.
Figure 3-45
Typical graphical result for scope-shot
Adjustable parameters in scopeshot_cal_pulseiv
Vds DC voltage for the drain
Vgs Pulse voltage level for gate
PulseWidth Vgs pulse width, full width half maximum (FWHM)
PulseAmplitude Vgs, gate voltage pulse
 Loading...