4200-900-01 Rev. K / February 2017 Return to Section Topics 4-37
Model 4200-SCS User Manual Section 4: How to Control Other Instruments with the Model 4200-SCS
4. In the Calc spreadsheet, click cell A1 to select it, and then press Ctrl + V. This pastes the
copied columns into the Calc spreadsheet. This after-stress data is now available to be
graphed.
5. In the Calc spreadsheet, rename the DrainI and GM columns to distinguish them as
after-stress (AS) data. For example, change DrainI to DrainI(AS), and change GM to
GM(AS).
6. Click the Graph tab for the present test (before-stress). In an open area of the graph,
right-click the mouse to open the graph menu. In the graph menu, click Define Graph to
open the graph definition window.
7. In the graph definition window, click the Y1/DrainI(AS) cell and the Y2/GM(AS) cell to select
them, and click Ok. The graph will now show the overlaid data.
8. From the graph menu, use the Legend and Graph Properties - Series items to add a
legend and to change the line properties of the graph, if desired.
How to control an external CV analyzer
This tutorial demonstrates how to control a Keithley Model 590 CV Analyzer to acquire
capacitance verses voltage (CV) data from a MOS capacitor. This tutorial also demonstrates how
to create a new KITE project. The new project will contain one UTM that is connected to a
standard CV user module supplied with each 4200-SCS.
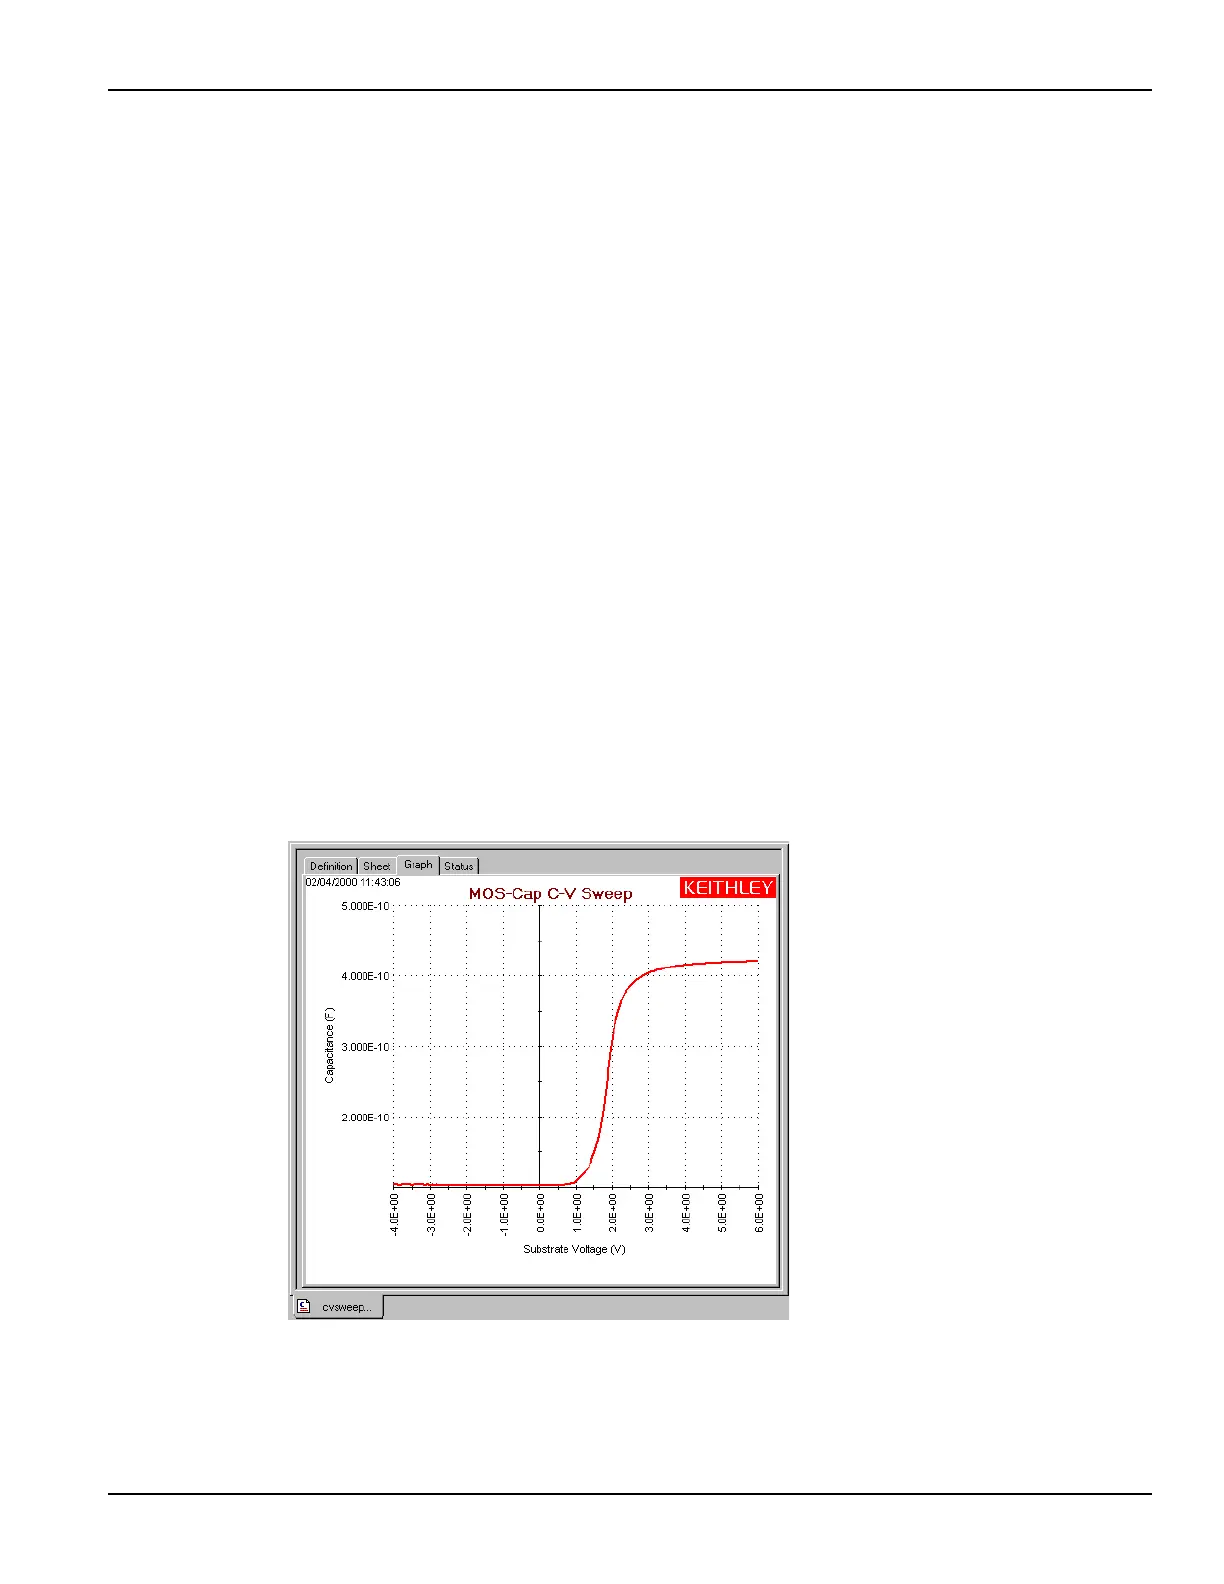
The CV Analyzer will apply a linear staircase voltage sweep to a capacitor. A capacitance
measurement will be performed on every voltage step of the sweep. Figure 4-57 shows a typical
CV curve generated by this test.
Figure 4-57
Typical CV curve
 Loading...