4200-900-01 Rev. K / February 2017 Return to Section Topics 3-97
Model 4200-SCS User’s Manual Section 3: Common Device Characterization Tests
Figure 3-77
Subsite graph tab: cycle mode
Stress/measure mode
The graphs for the stress / measure mode plot degradation (in %) versus the
stress times. Each data point in the graph represents the device degradation (%
Change) for tests after each stress cycle (stress time). Figure 3-78 explains how
to show the graphs for a selected device test.
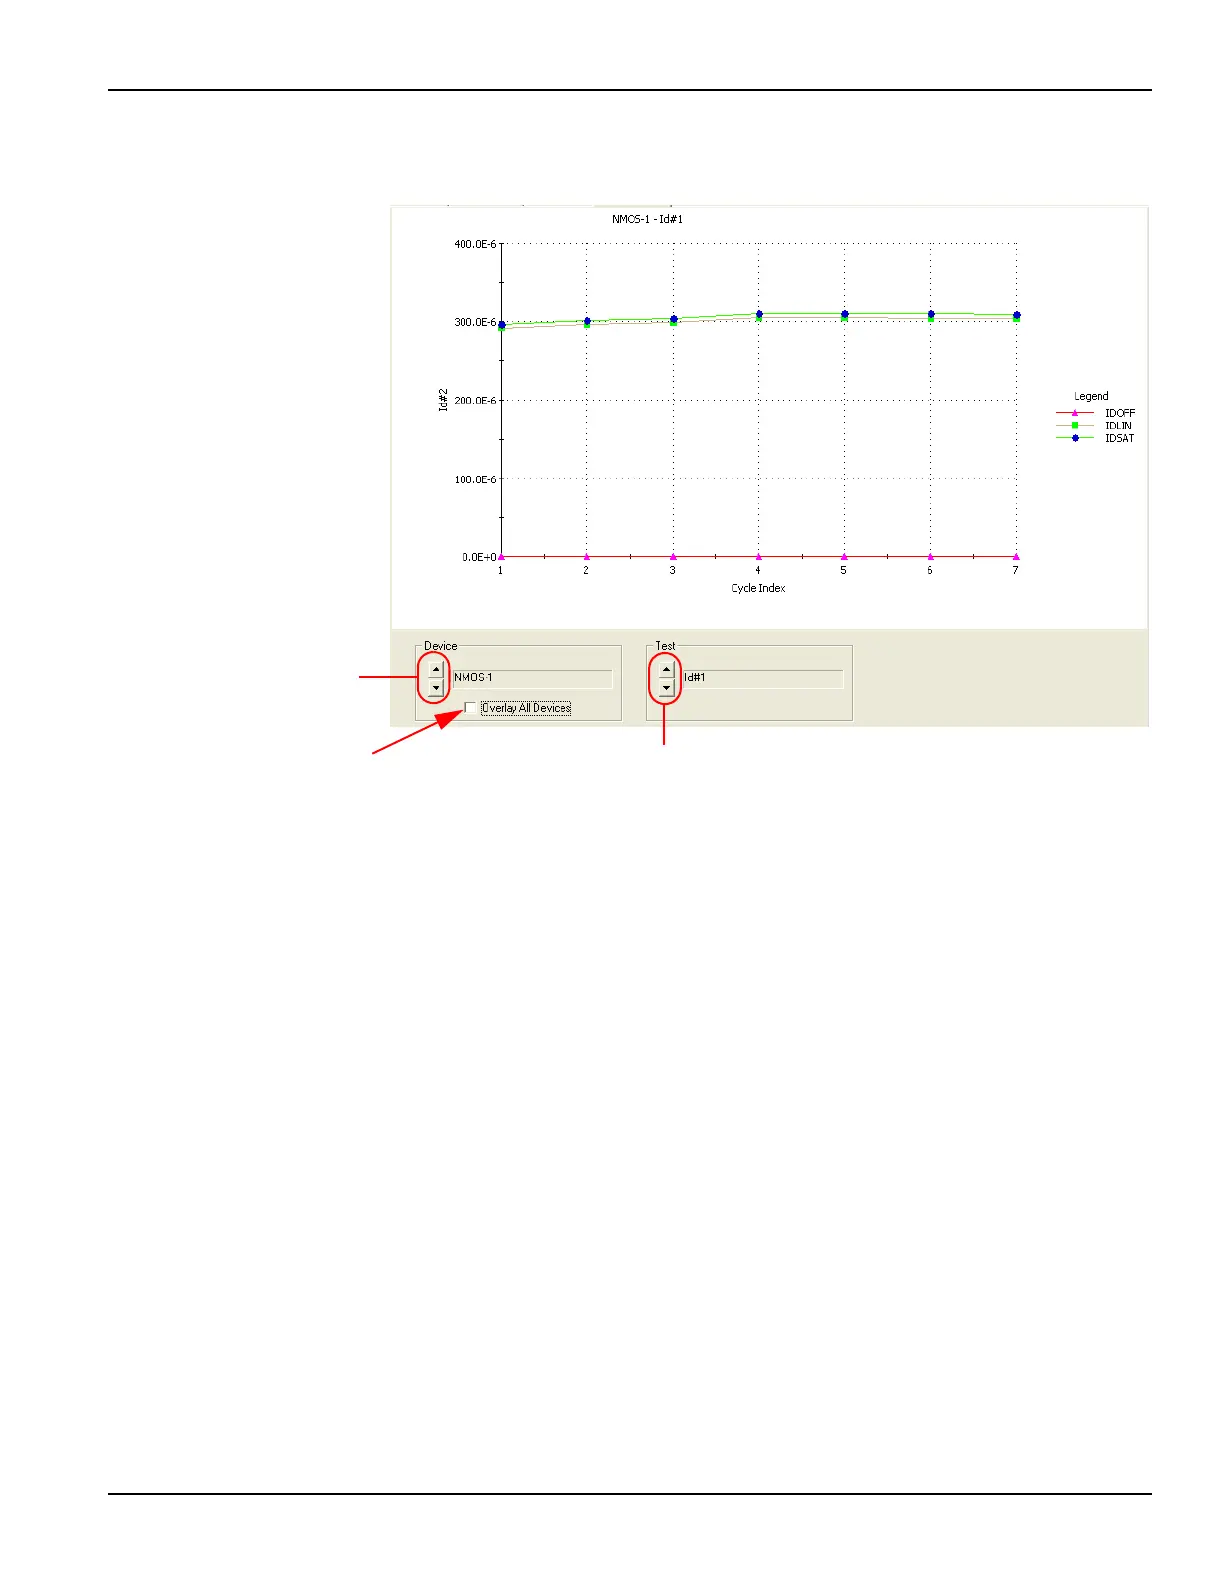
Figure 3-78 shows the graph traces for test ID#1 for the 4terminal-n-fet device.
The three traces are for Output Values IDOFF, IDLIN and IDSAT.
1) Use to select device.
2) Use to select test.
Click (enter √) to display all the graph
traces for all devices that were measured
by the selected Test.
NOTE
For a single-device
subsite plan, the Device
select buttons and the
checkbox to Overlay All
Devices are disabled.
For a single-test subsite
plan, the Test select
buttons are disabled.
 Loading...