3-44 Return to Section Topics 4200-900-01 Rev. K / February 2017
Section 3: Common Device Characterization Tests Model 4200-SCS User’s Manual
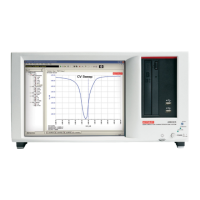
Figure 3-43
Default definition and typical graph for vgs-id-pulse
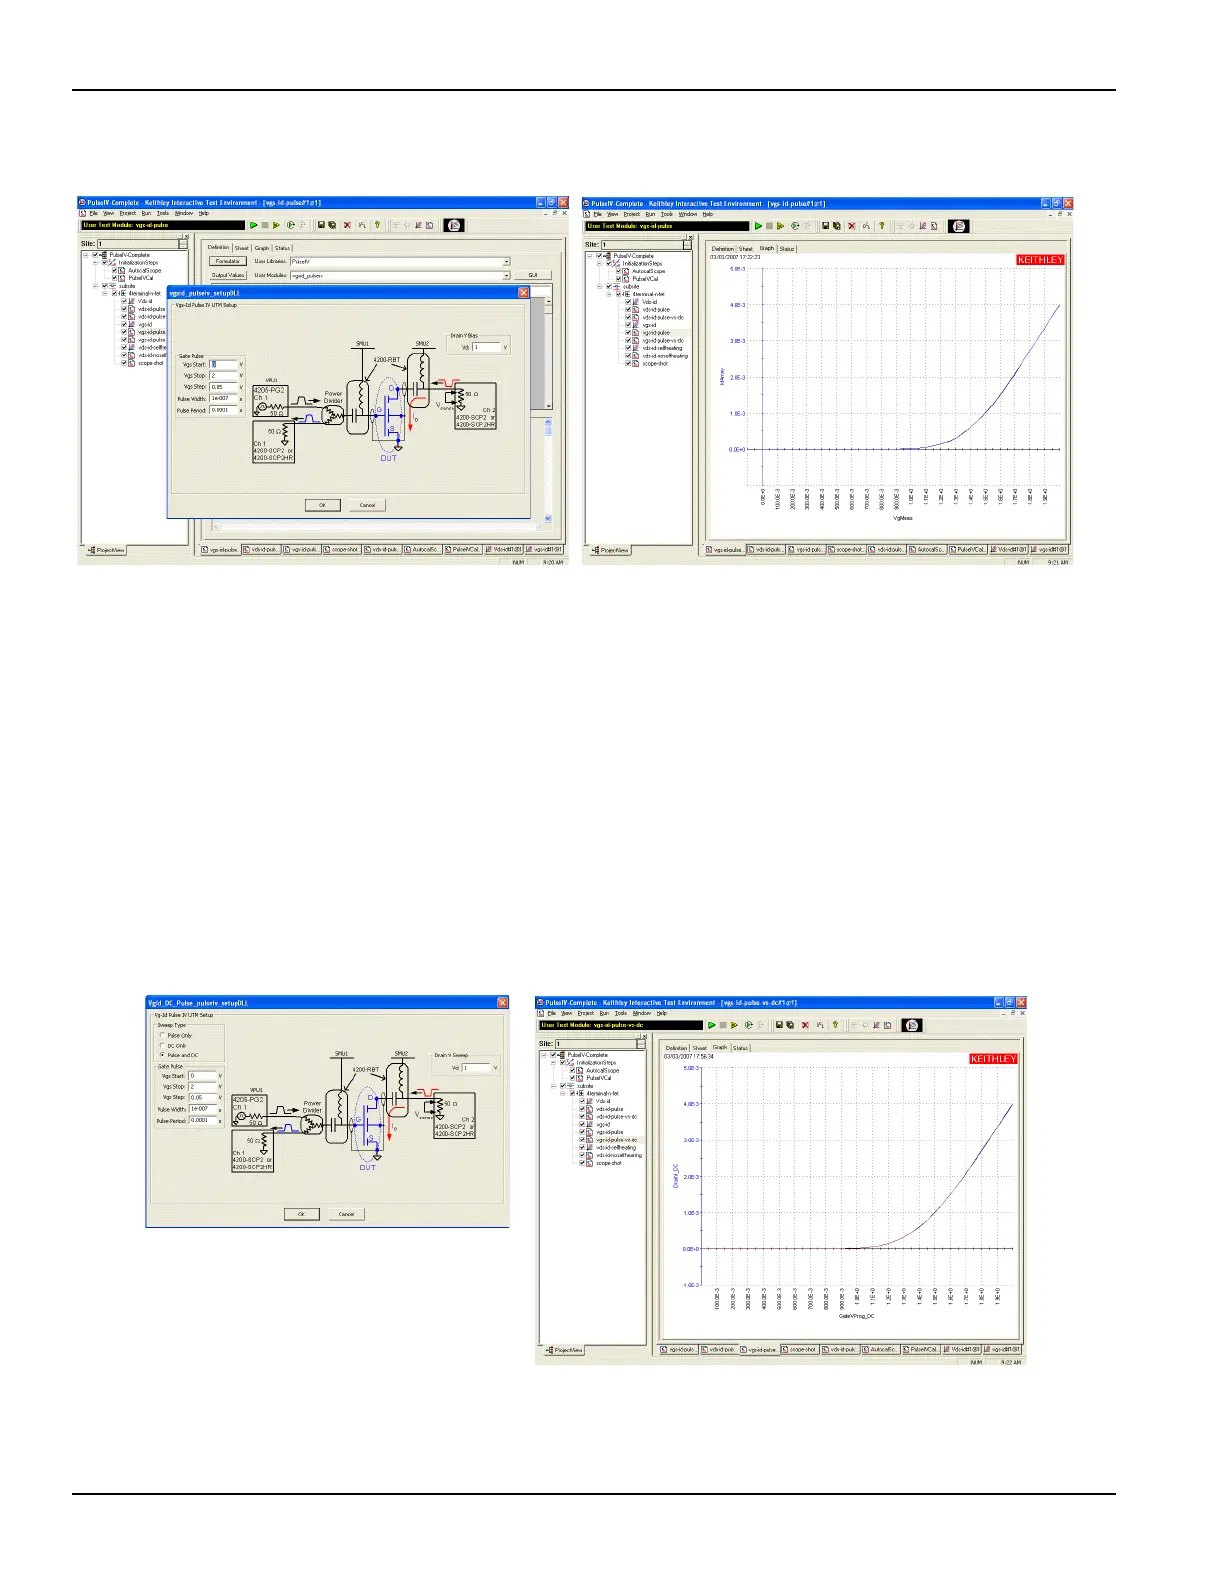
Running vgs-id-pulse-vs-dc UTM
Instead of using the separate vgs-id ITM and vgs-id-pulse UTM to compare DC
and pulse Vg-Id results, the vgs-id-pulse-vs-DC UTM combines both DC and
pulse tests (see Figure 3-44):
1. If measurement parameters (pulse average, NPLC, measure range) need to be set, use the
definition table.
2. (Optional) If only source parameters need to be changed, use the UTM GUI by clicking on
the GUI button on the Vds-id-pulse-vs-DC test. Modify the source parameters and click OK
when finished.
3. Click the green Run button. For a test with 40 points, the test should take about one minute.
During the test, neither the graph tab or sheet tab is updated.
Figure 3-44
Default GUI definition and typical graph for vgs-id-pulse-vs-dc
 Loading...