4200-900-01 Rev. K / February 2017 Return to Section Topics 1-43
Model 4200-SCS User’s Manual Section 1: Getting Started
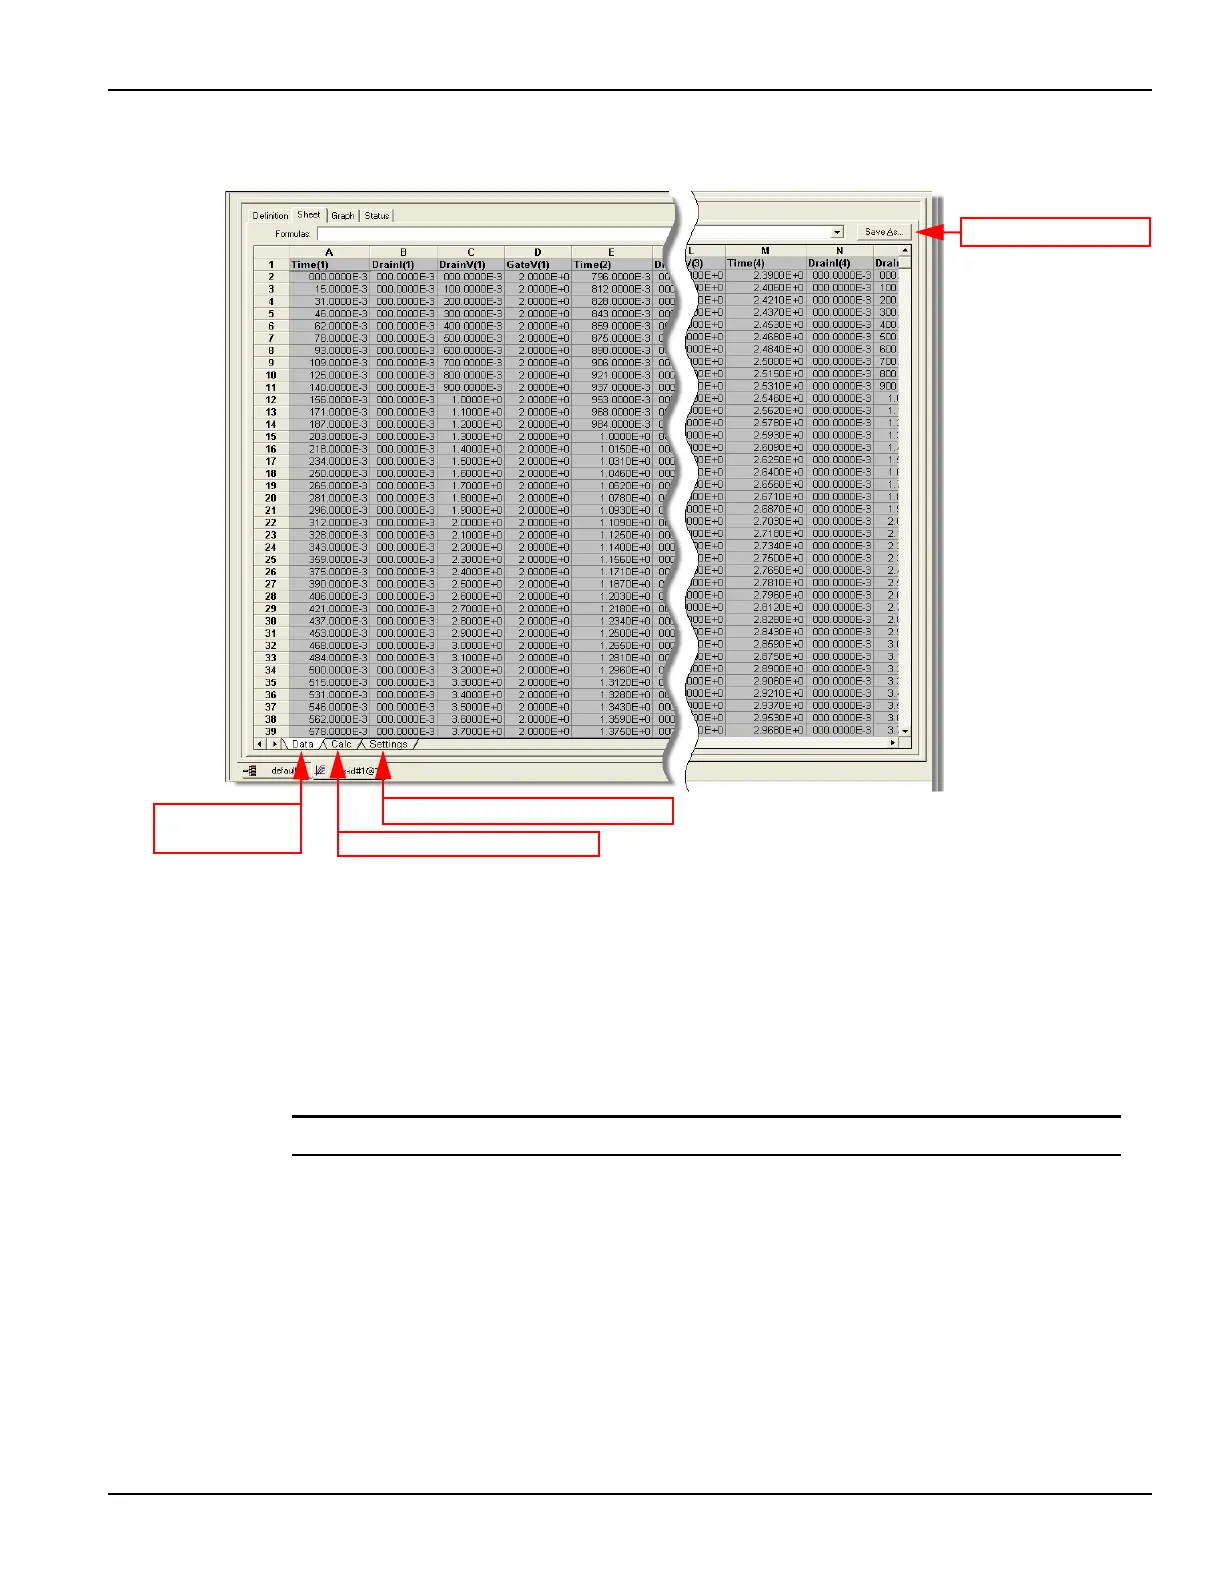
Figure 1-37
Sample data sheet for vds-id test
* To select more than one sheet for selective printing, hold down the Ctrl key and then click the
tab.
** The data is saved as a Microsoft® Excel® ( *.xls ) document.
To save the Data sheet:
1. In the KITE workspace, click the Sheet tab to display the test data.
2. In the Sheet tab, click the Save As button as shown in Figure 1-37.
3. From the Save As dialog box, specify a file name and path, and click Save.
NOTE The default directory path for exporting data is C:\S4200\kiuser\export.
View and save the graph data
The graph for the vds-id test is displayed by clicking the Graph tab for the test. A sample graph for
the vsd-id test is shown in Figure 1-38. As shown, there are four I-V curves - one for each gate
voltage. The graph was customized to include the Legend box and use different colors for the
graph series. The Graph Settings menu (shown in Figure 1-39) was used to select the Legend box
and change series colors. For more Graph tab information Refer to the Reference Manual,
Viewing ITM or UTM results graphically: The Graph tab, page 6-23.
Click to export data**
Click to display
Data sheet*.
Click to display Calc sheet*.
Click to display Settings sheet*.