1-44 Return to Section Topics 4200-900-01 Rev. K / February 2017
Section 1: Getting Started Model 4200-SCS User’s Manual
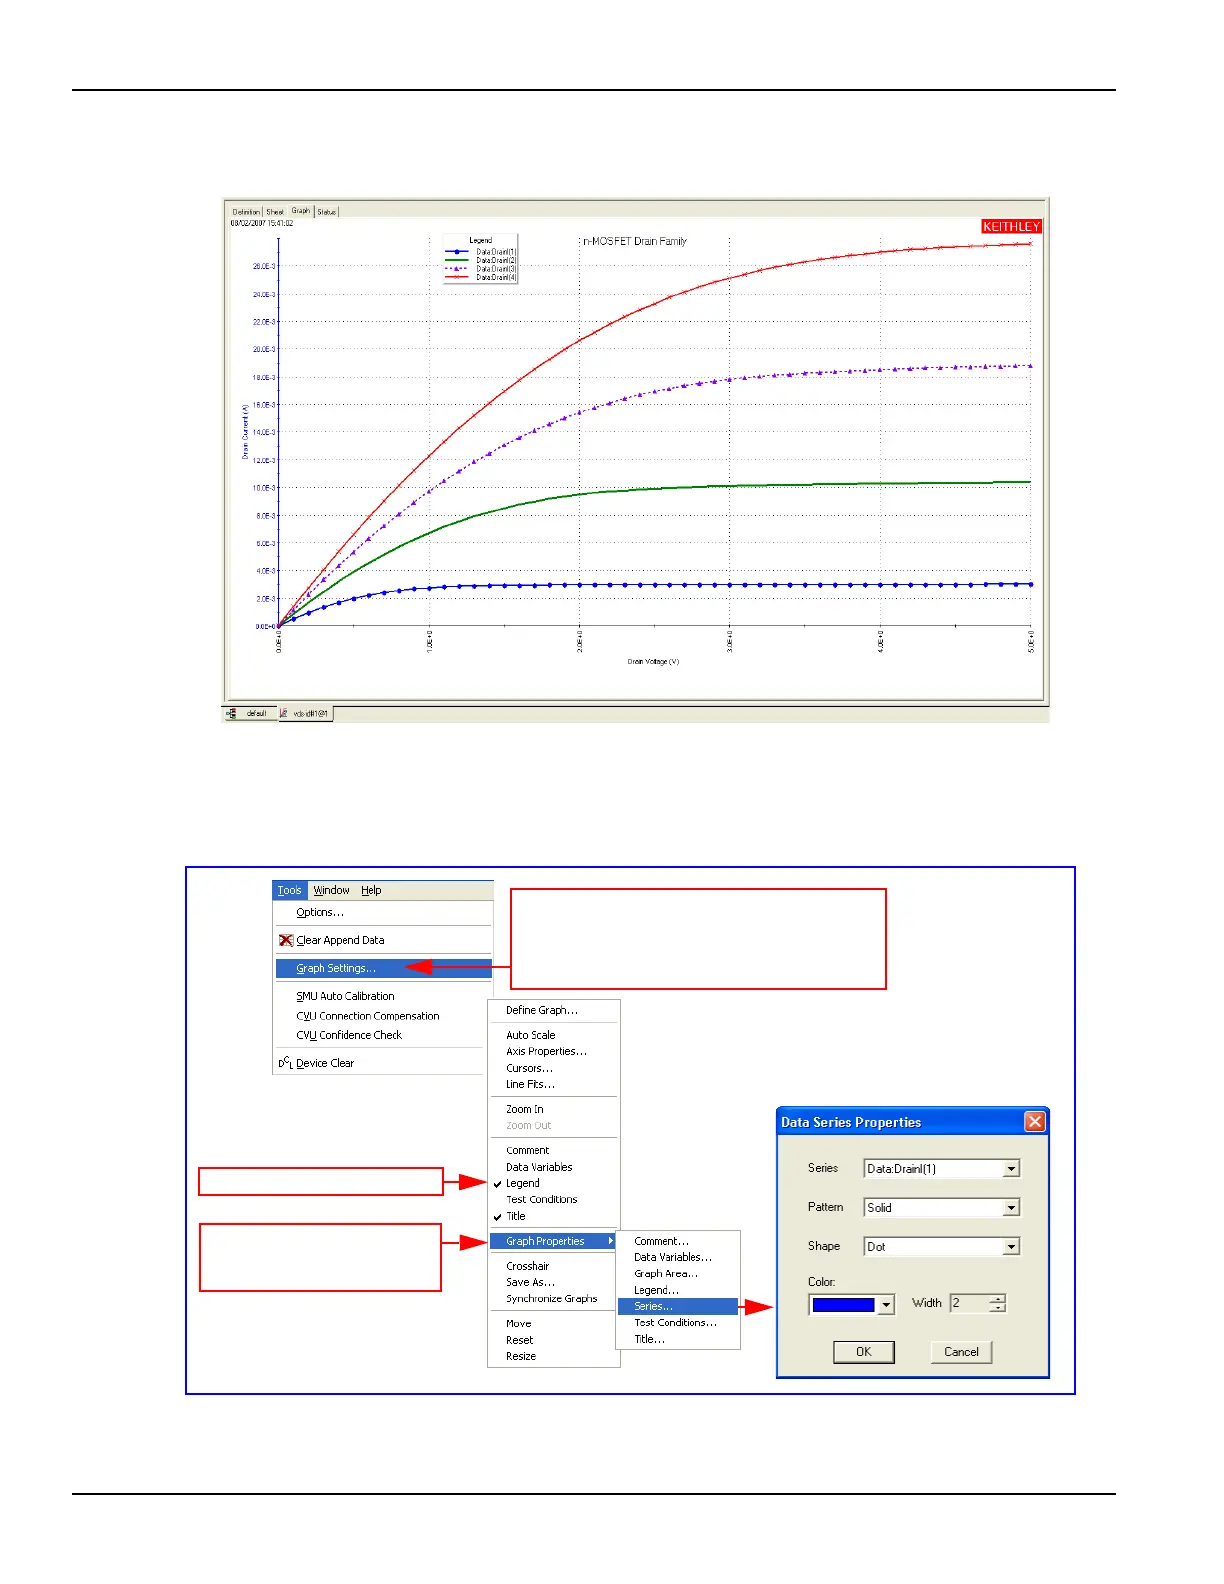
Figure 1-38
Sample graph for vds-id test
In Figure 1-38 you can see that the line colors, line patterns, plot symbols, and line widths are
different. To learn how to define the graph line properties see Figure 1-39 below.
Figure 1-39
Graph settings menu
* To learn more about Data Series Properties refer to the Reference Manual, Defining the plot
properties of the graph: colors, line patterns, symbols, line widths, page 6-223.
To display the Graph Settings menu: Right-mouse
click anywhere in the graph area*.
OR
From the Tools menu, select Graph Settings.
Click to select ( 3 ) Legend Box.
Click Graph Properties and then
Series to change the properties
for each of the four series.
 Loading...