3-96 Return to Section Topics 4200-900-01 Rev. K / February 2017
Section 3: Common Device Characterization Tests Model 4200-SCS User’s Manual
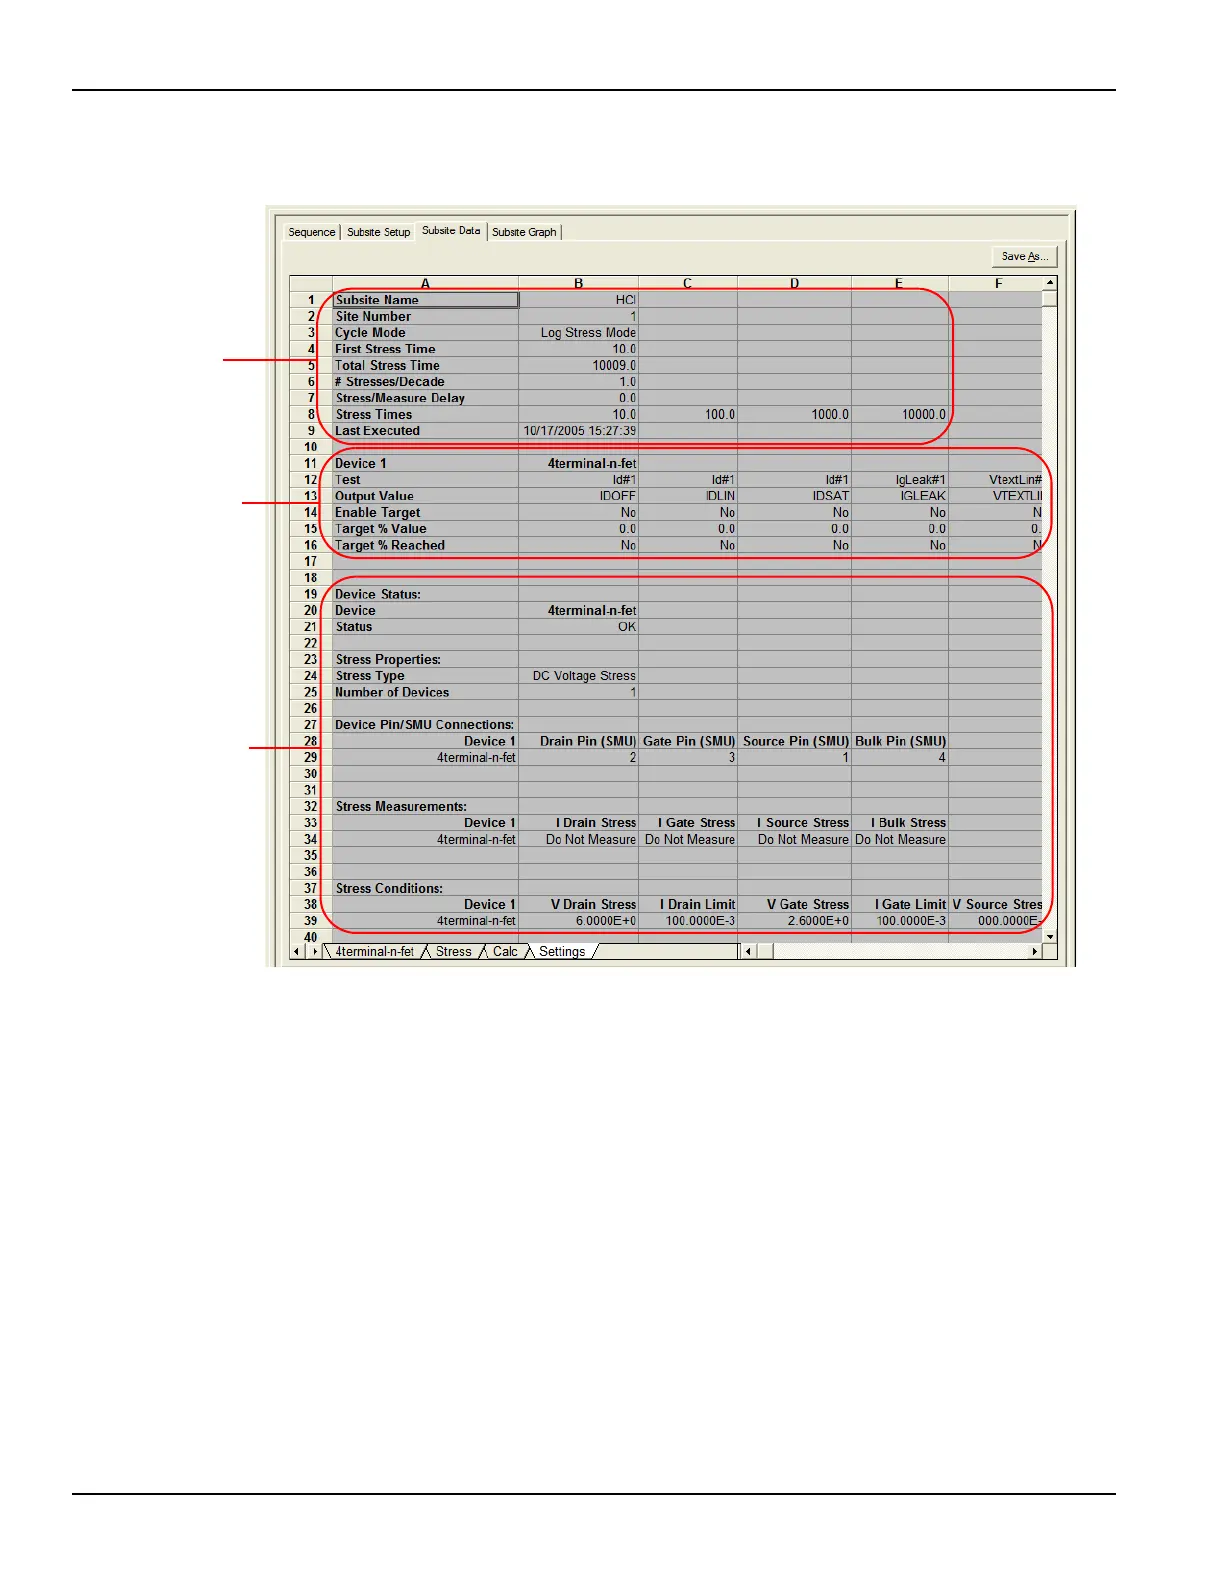
Figure 3-76
Subsite Data: Settings window for Stress / Measure Mode
Subsite cycling graphs
Graphs for subsite cycling are located in the Subsite Graph tab of the Subsite
Plan.
Cycle mode
The graphs for the Cycle Mode plot Output Values versus the cycle index. Each
data point in the graph represents an Output Value reading for each subsite cycle.
Figure 3-77 explains how to display the various graphs.
Figure 3-77 shows the graph traces for test ID#1 for the NMOS-1 device. The
three traces are for Output Values IDOFF, IDLIN and IDSAT.
Output Values and
Target information:
Lists Output
Values
Identifies enabled
Tar g ets
Lists the Target %
Values
Indicates if a
Target was
reached
Subsite cycling
setup
Additional
information
provided for the
stress / measure
mode
 Loading...