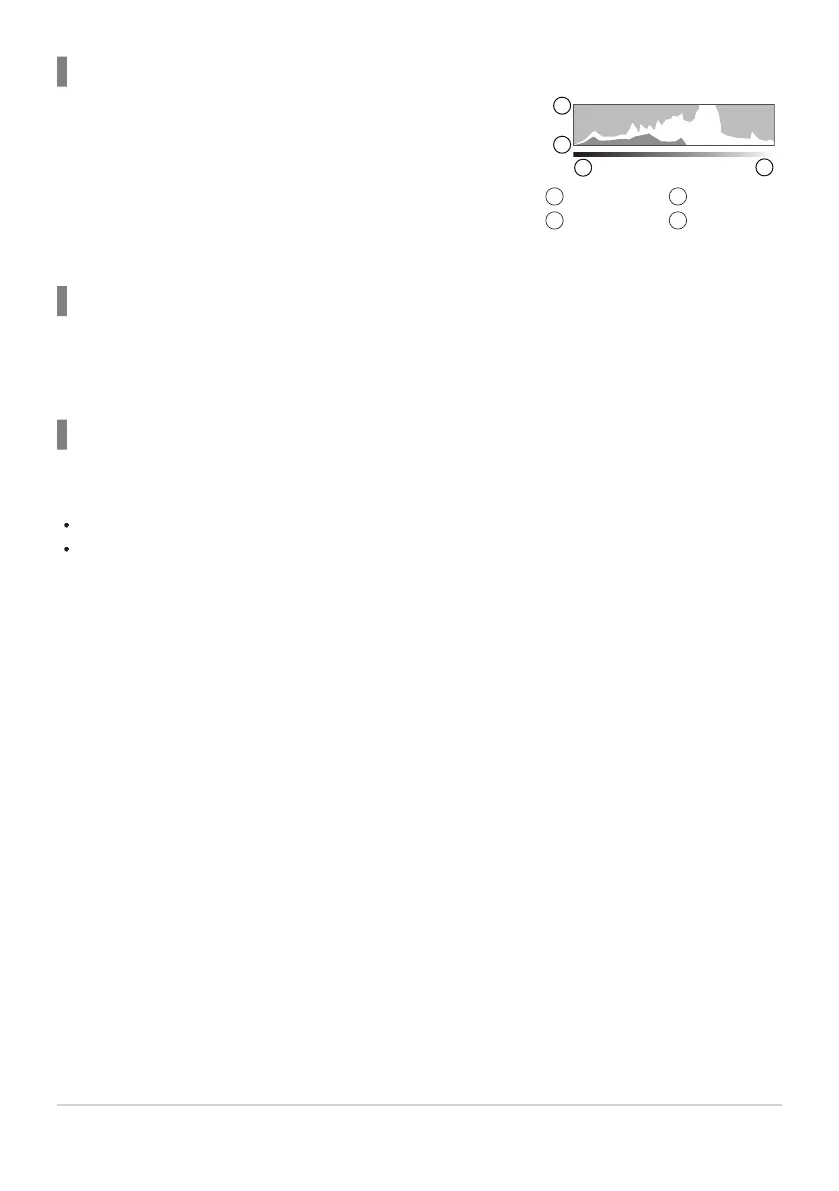
A histogram showing the distribution of brightness in the image is
displayed. The horizontal axis gives the brightness, the vertical axis
the number of pixels of each brightness in the image. Areas above
the upper limit at shooting are displayed in red, those below the
lower limit in blue, and those within the spot metering range in
green. You can choose the upper and lower limits. g“Histogram
Exposure Warning (Histogram Settings)” (P.380)
More
Less
1
2
Dark
Bright
3
4
Histogram display
Highlights and Shadows
Highlights and shadows, defined according to the upper and lower limits for the histogram display, are
shown in red and blue. You can choose the upper and lower limits. g“Histogram Exposure Warning
(Histogram Settings)” (P.380)
Level gauge display
The orientation of the camera is indicated. The “tilt” direction is indicated on the vertical bar and the
“horizon” direction on the horizontal bar.
The level gauge is intended as a guide only.
Calibrate the gauge if you find it is no longer truly plumb or level. g“Calibrating the Level Gauge
(Level Adjust)” (P.418)
50
Switching between displays
 Loading...