6-5
Chapter 6. Display and Setting Data
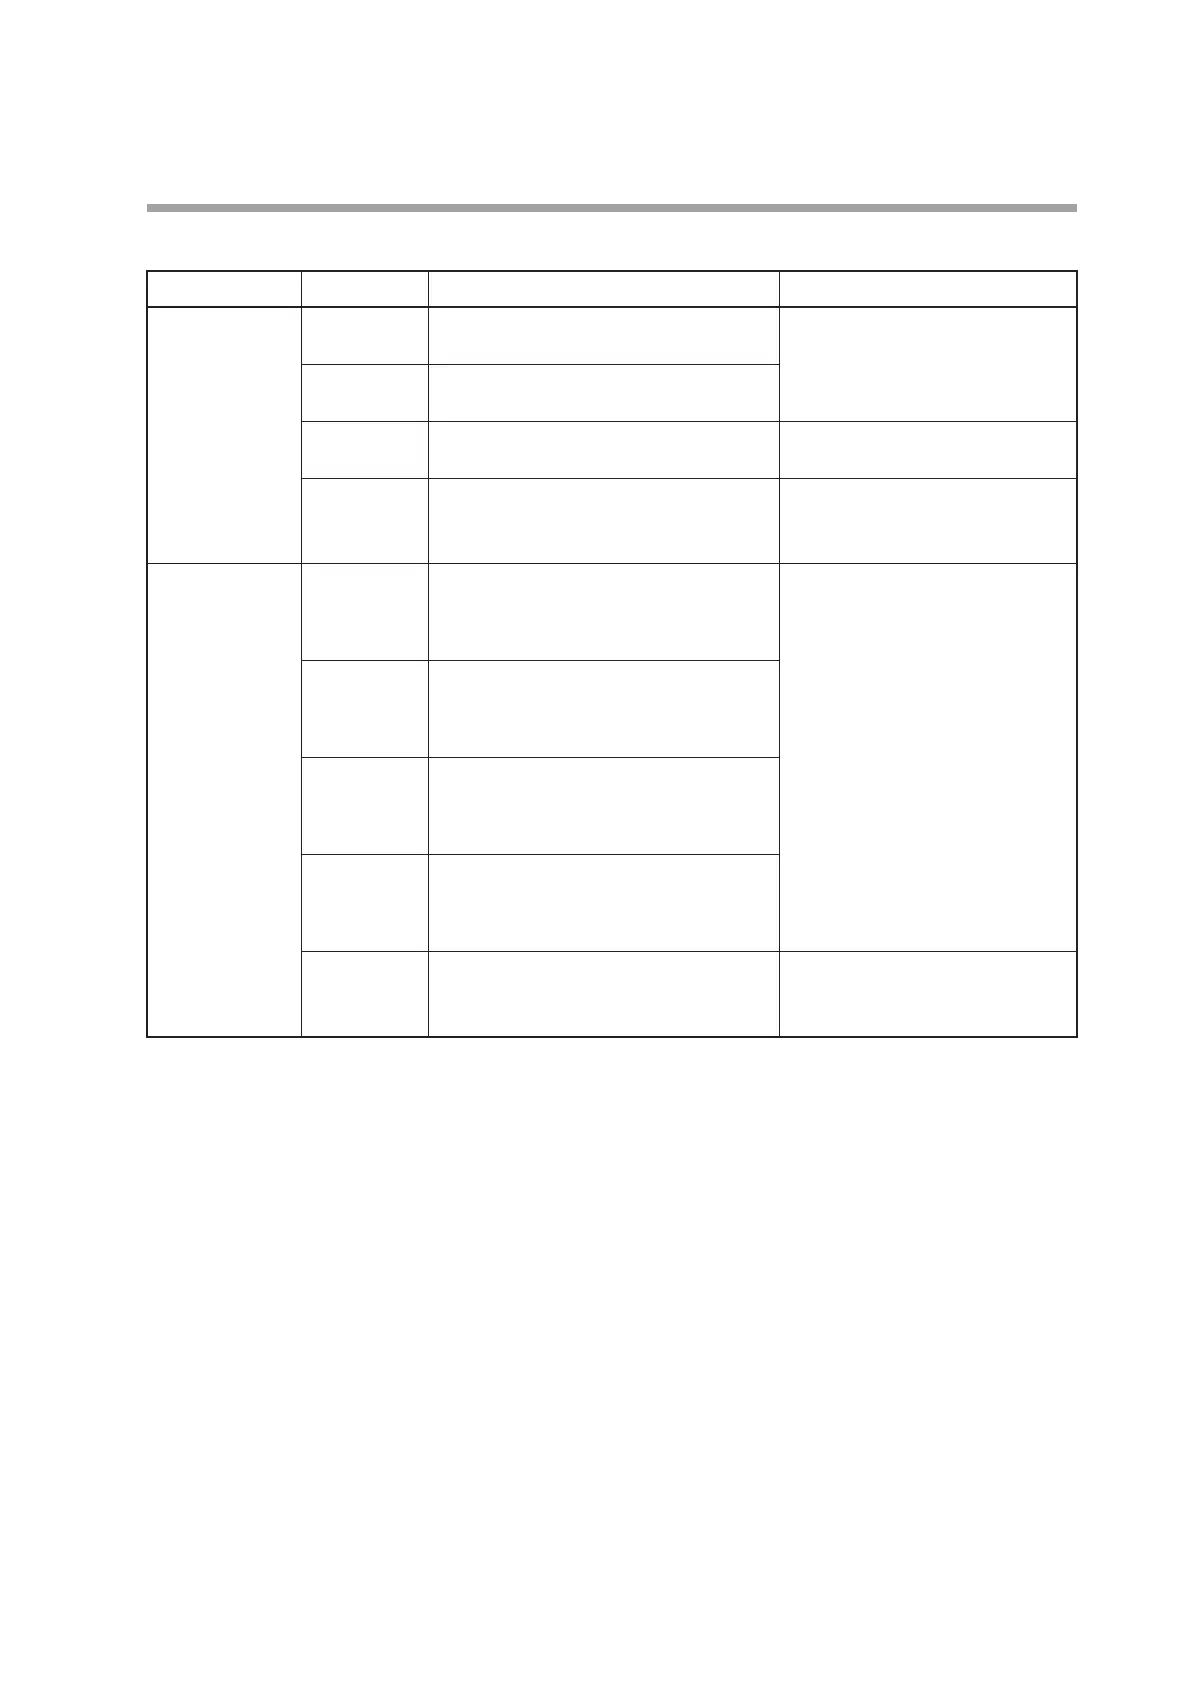
Graph screen
Screen Graph Description Notes
1-loop graph screen PV Displays the PV using a graphed line.
The scale uses the vertical axis on the left.
The vertical axis on the left is set by the
"Graph scaling low limit for loops 1 to 4"
and "Graph scaling high limit for loops
1 to 4" parameter settings of the Graph
bank.
SP Displays the SP using a graphed line.
The scale uses the vertical axis on the left.
MV Displays the MV using a graphed line.
The scale uses the vertical axis on the right.
The vertical axis on the right is fixed to
0 to 100 %.
Horizontal axis
(time axis)
The time for one scale gradation is displayed
under the graph.
The range of the horizontal axis can be
changed by the "Recording cycle for
loops 1 to 4" parameter setting in the
Graph bank.
Multi-loop graph
screen
PV1 Displays the PV of loop 1 using a graphed line.
The vertical axis is set by the "Graph scaling low
limit for loop 1" and "Graph scaling high limit for
loop 1" parameter settings of the Graph bank.
The PV corresponding to the number of
loops is displayed.
The scales of the vertical axes on the left
and right can be selected from Loop1
to 4.
PV2 Displays the PV of loop 2 using a graphed line.
The vertical axis is set by the "Graph scaling low
limit for loop 2" and "Graph scaling high limit for
loop 2" parameter settings of the Graph bank.
PV3 Displays the PV of loop 3 using a graphed line.
The vertical axis is set by the "Graph scaling low
limit for loop 3" and "Graph scaling high limit for
loop 3" parameter settings of the Graph bank.
PV4 Displays the PV of loop 4 using a graphed line.
The vertical axis is set by the "Graph scaling low
limit for loop 4" and "Graph scaling high limit for
loop 4" parameter settings of the Graph bank.
Horizontal axis
(Time axis)
The time for one scale gradation is displayed
under the graph.
The range of the horizontal axis can be
changed according to the "Recording
cycle of multi-loop" parameter setting in
the Graph bank.