5-15
Chapter 5. Screens
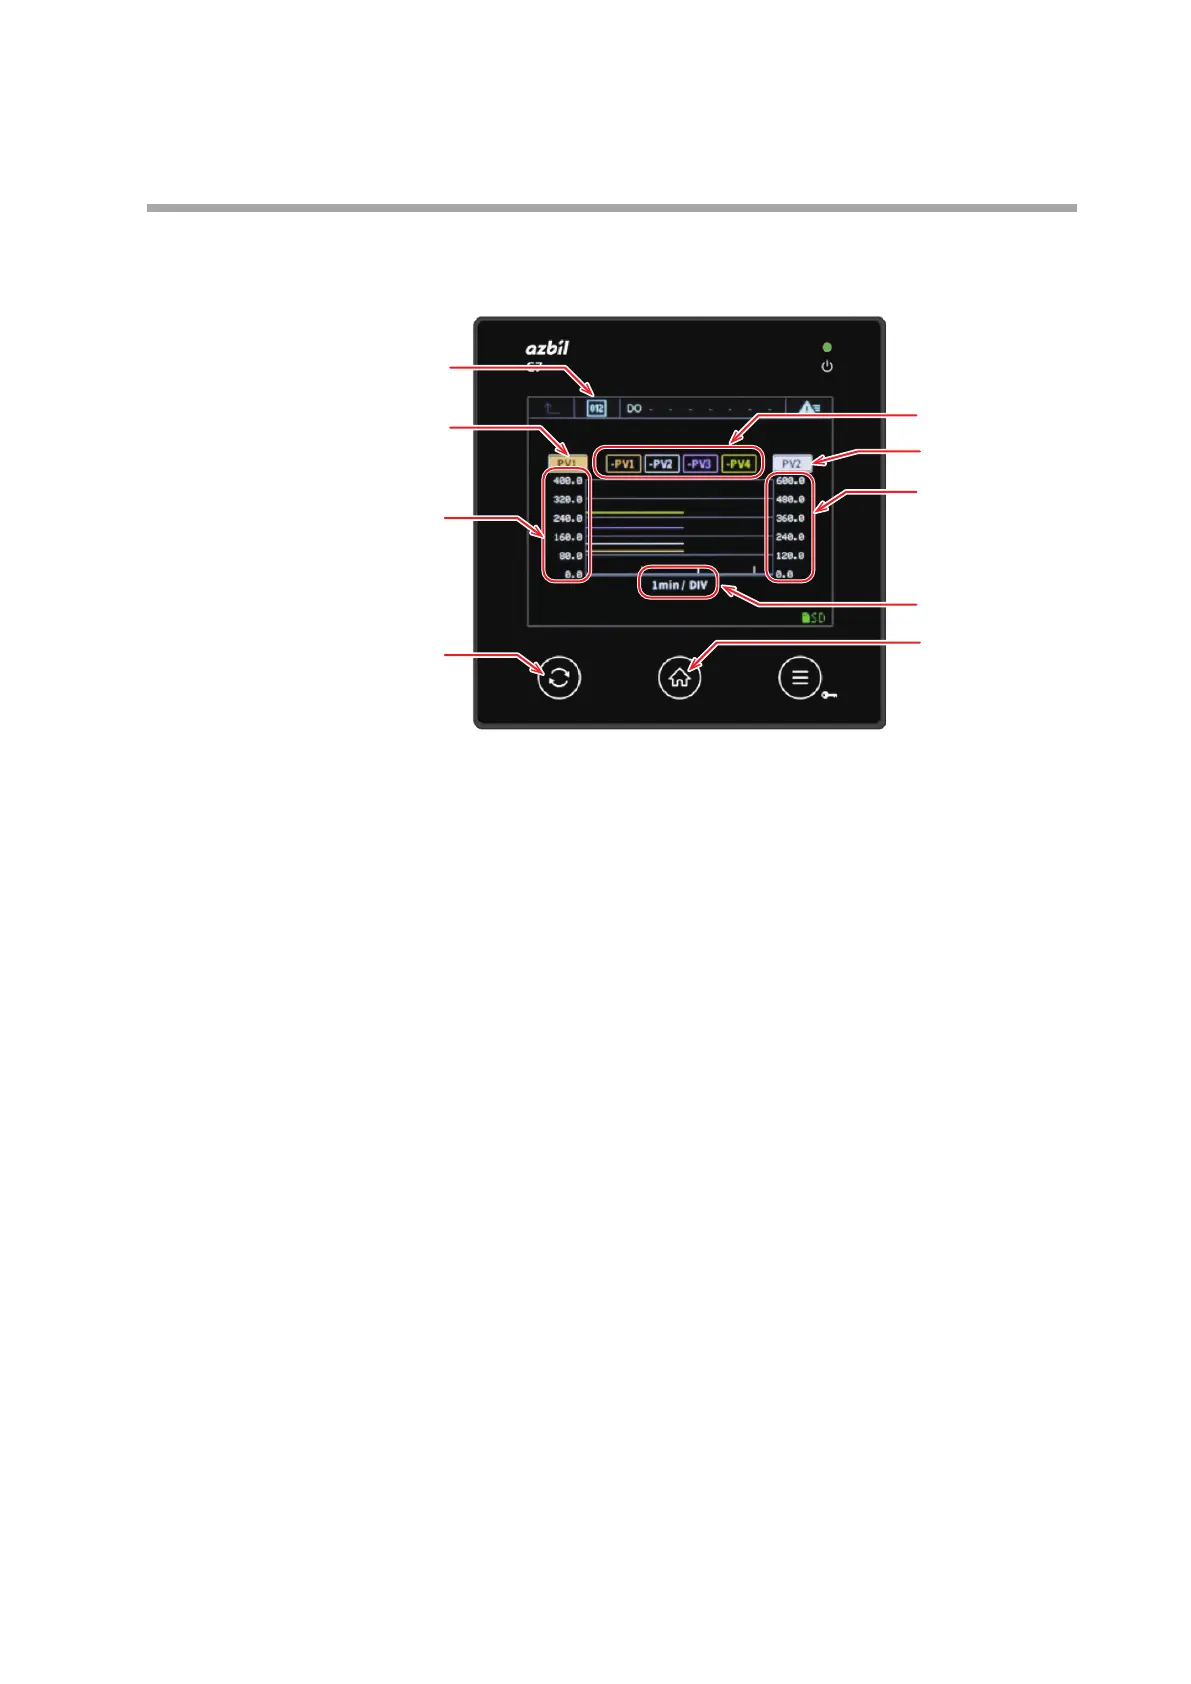
Multi-loop graph screen
This screen displays the PV graphs of up to 4 loops.
(7)
(9)
(4)
(5)
(6)
(3)
(1)
(8)
(2)
(1) Numeric icon
Touching this icon displays the Home screen.
(2) Left axis button
Shows which loop's PV scale is shown on the left axis of the graph.
Touching this button changes the scale on the left axis to the PV of another loop.
(3) Left axis scale
Displays the PV scale of the loop displayed on the left axis button.
The display range can be set using the graph scaling low limit and graph scaling
high limit parameters (in the Graph bank) of this loop.
(4) Right axis button
Shows which loop's PV scale is shown on the right axis of the graph.
Touching this button changes the scale on the right axis to the PV of another
loop.
(5) Right axis scale
Displays the PV scale of the loop displayed on the right axis button.
The display range can be set using the graph scaling low limit and graph scaling
high limit parameters (in the Graph bank) of this loop.
(6) Graph time axis
The scale of the time axis is 60 times larger than the setting of the recording
cycle parameter (in the Graph bank).
If the set value of the recording cycle is a multiple of 60, the scale of the time
axis is h (hours)/DIV. In other cases, the scale is min (minutes)/DIV.
Example:
• If the recording cycle setting is 30, the scale is 30 min/DIV.
• If the recording cycle setting is 60, the scale is 1 h/DIV.