1. Select the
<Graphs>
menu.
The system displays graphs.
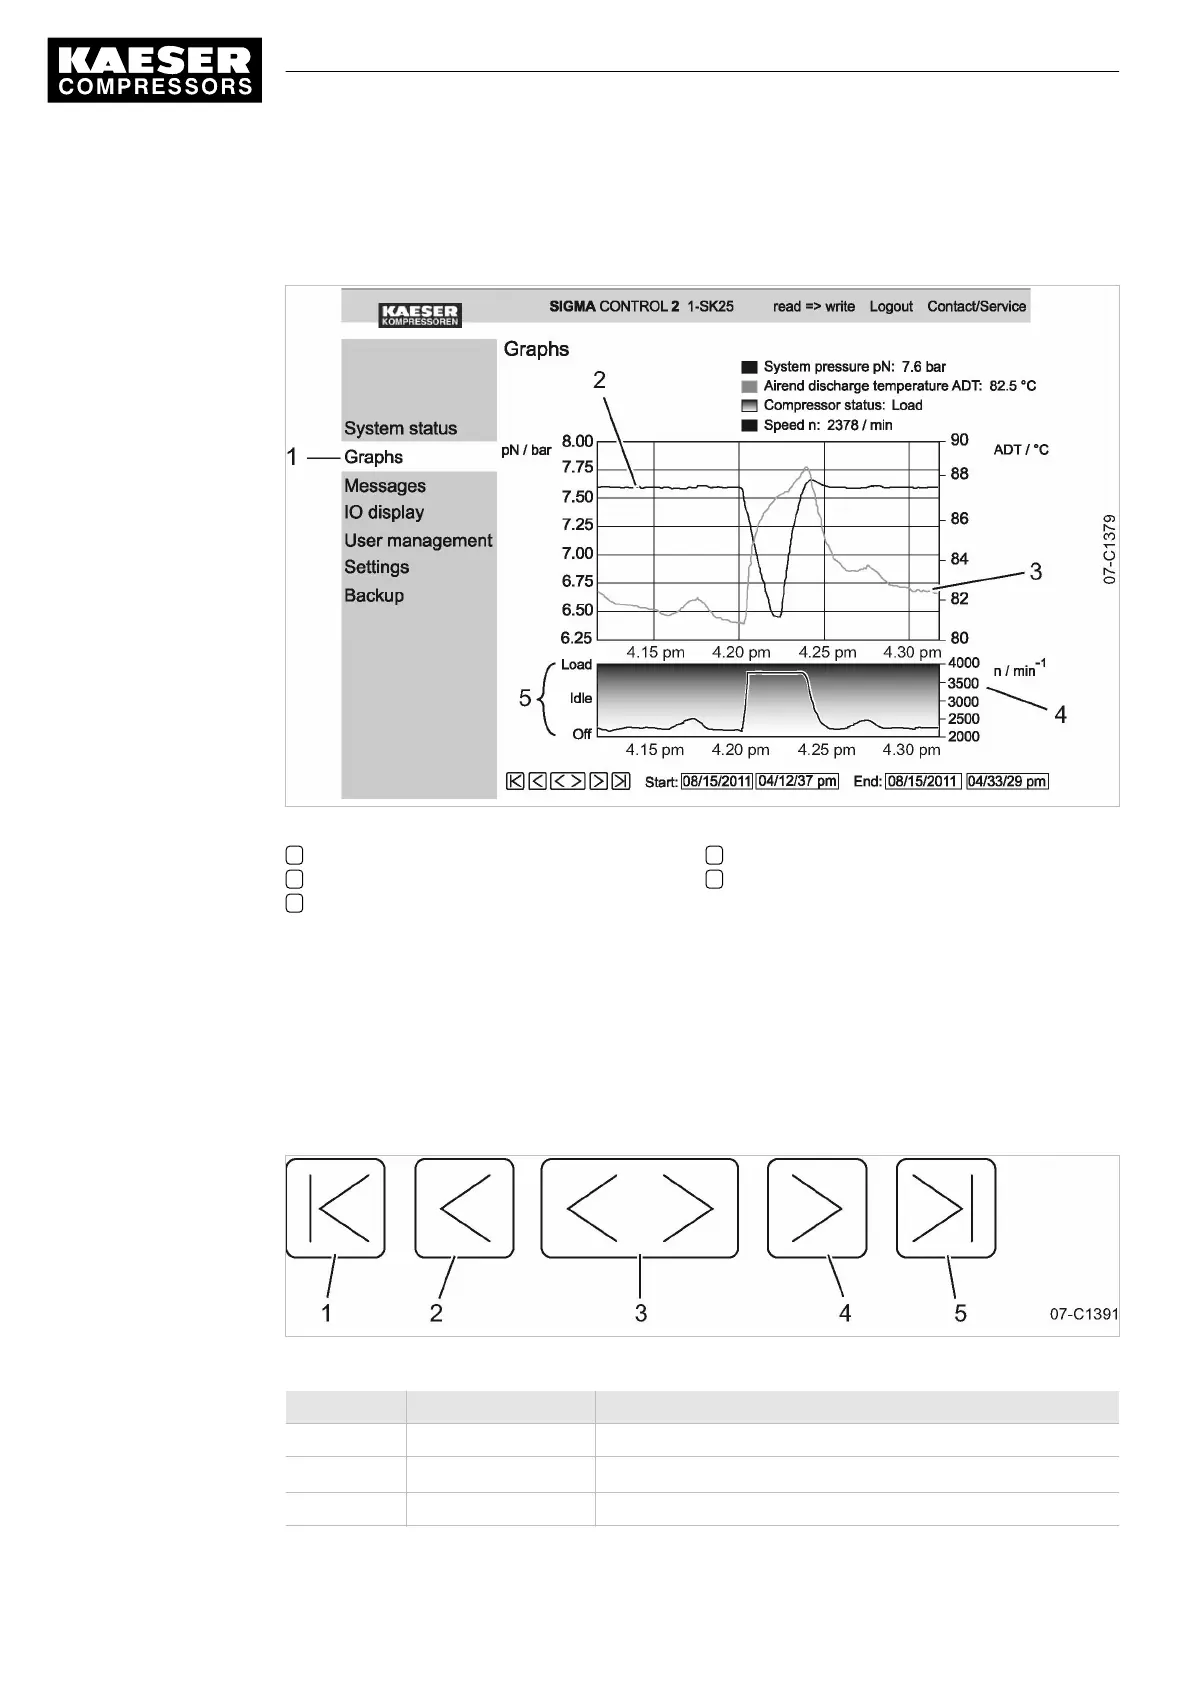
Fig. 16 Pressure/temperature graphs
1
<Graphs>
menu
2 System pressure
3 Airend discharge temperature
4 Speed
5 Machine status
2. Check pressure development
3. Check airend discharge temperature.
7.3.3.1 Zoom and arrow key functions
Use the Zoom-in function to enlarge significant curve developments:
Highlight a specific area within the graph by drawing a rectangle with the mouse pointer pressed.
The selected area will be enlarged as soon as the mouse pointer is released.
Fig. 17 Arrow keys
Position Name Function
1 «Start» Display of oldest data
2 «Scroll left»
Shift the display area by
1
/
3
to the left
3 «Zoom-out» Time range is enlarged
7 Initial Start-up
7.3 Using KAESER CONNECT
52
Service manual Controller
SIGMA CONTROL 2 SCREW FLUID 1.1.3 9_9450 03USE