Average C/No: Average signal to noise ratio. An average C/No value higher than
30 can be considered "good".
Skyplot graph
The center of the skyplot represents the antenna position. The skyplot shows all GPS satel-
lites currently being tracked and – if enabled (under INTERFACES: REFERENCES >
GNSS Reference: GNSS 0 > Edit button > Selected Constellations) – will also display
all GLONASS satellites (numbered 65 and higher). Note, however, that GLONASS satel-
lites will not be used by BroadShield. Galileo and Beidou satellites will not be displayed.
Note: Even though SecureSync may be configured to track multiple GNSS
constellations (see "Selecting GNSS Constellations" on page221 ),
BroadShield only uses GPS.
Signal-to-noise bar graph
This graph visualizes the signal-to-noise ratio for up to 20 received satellites in real time.
The satellites are numbered by their NMEA ID's (as in the skyplot mentioned above).
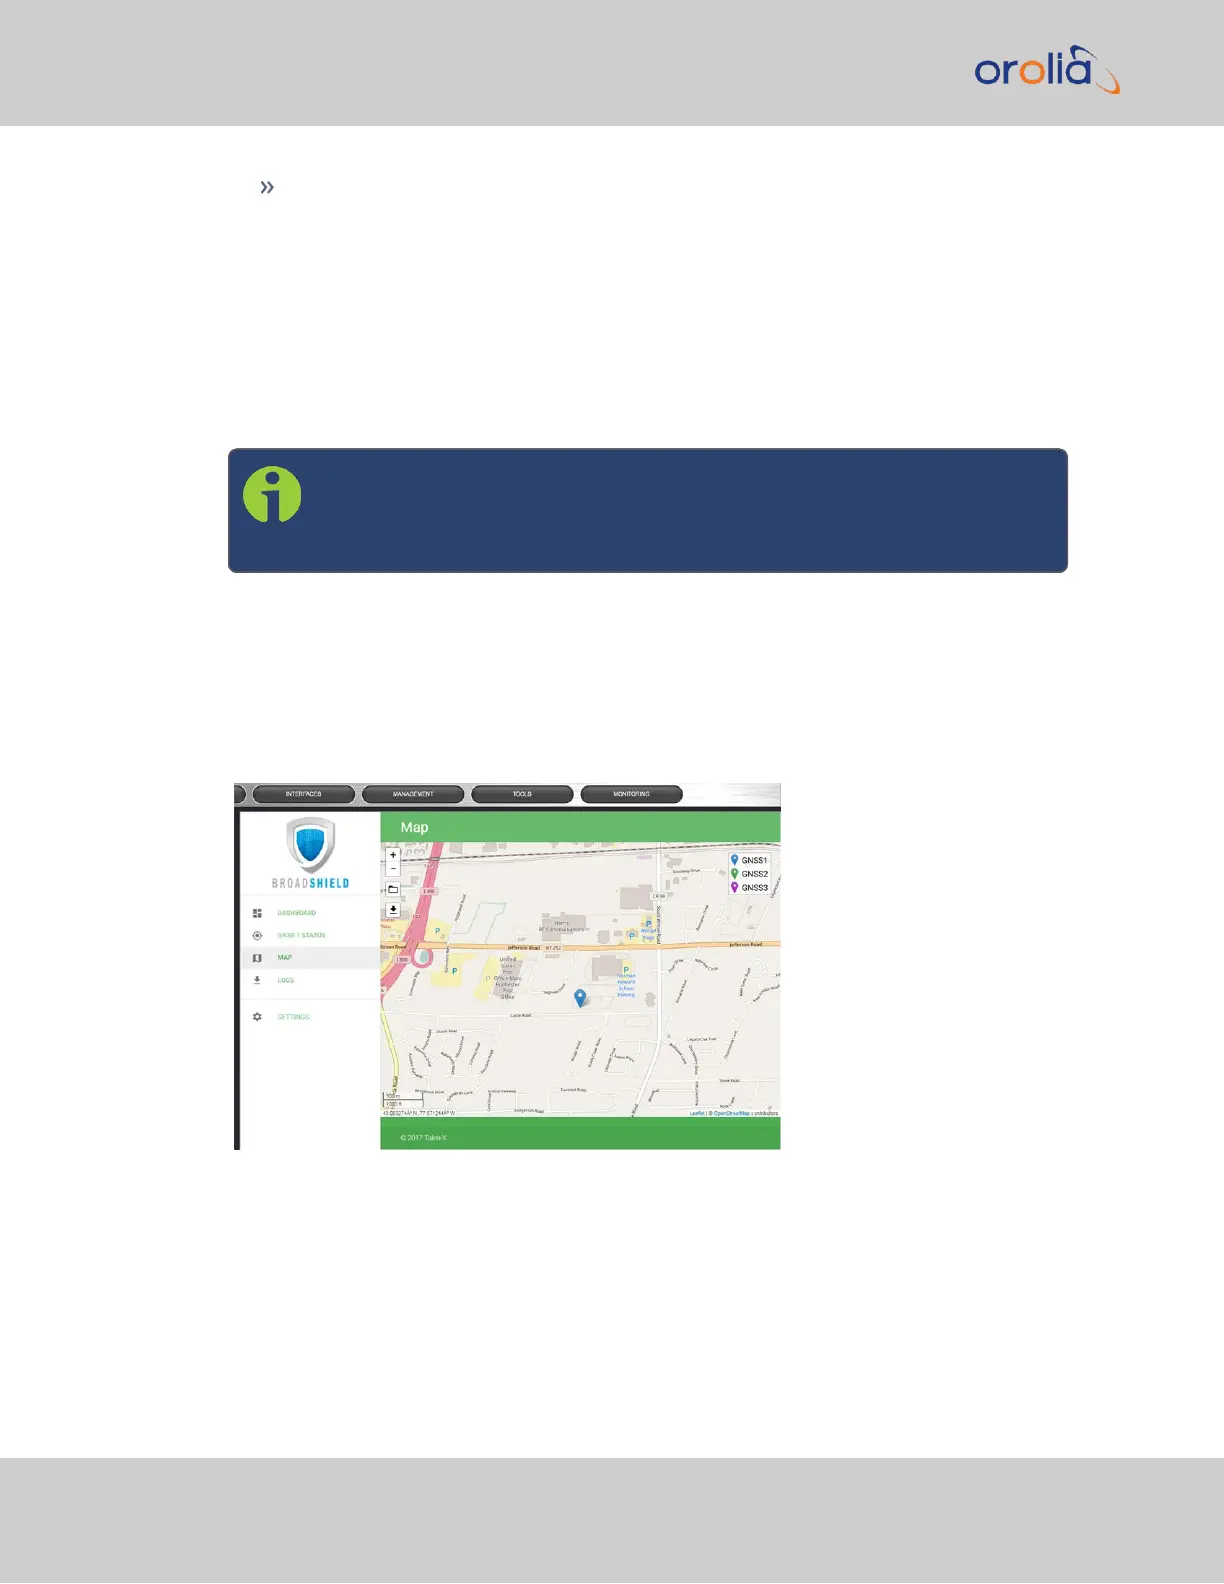
MAP
The map displays your current position, as reported by the GPS receiver. Should the dis-
played position differ from the actual antenna position, the GPS signal is likely spoofed.
Note that the map data is not part of the BroadShield software, but is downloaded from the
Internet. Hence, this feature is only available if your SecureSync unit is connected to the
Internet.
202
CHAPTER 3 • SecureSync 2400 User Manual Rev. 2
3.3 Managing References